20th Dec 2023. 8.55am

Regency View:
BUY Centamin (CEY) – Second Tranche
- Value

Regency View:
BUY Centamin (CEY) – Second Tranche

Centamin shines bright: Growth and promise in 2024
Centamin has been our pick of the FTSE’s gold miners for the last year, and we believe the stock will shine bright in 2024.
We snapped up our first tranche of the stock in April and after publishing a strong Resource & Reserve Update this week, we’re keen to add to our position.
Centamin’s gold reserves surge by 28%
Centamin’s update, published yesterday revealed that gold reserves have surged by 28% to 7.7 million ounces (Moz) in 2023. This growth was primarily led by a 10% increase in the Sukari Gold Mine’s reserves compared to the new Life of Mine Plan.
Martin Horgan, CEO, attributed this rise to improved geological understanding at Sukari, resulting in a 500 thousand ounce boost in reserves, surpassing the earlier 5.3 million ounce estimate. The Company exceeded its 3 million ounce target, achieving 3.5 million ounces of Mineral Reserve growth since 2020.
The progress made in 2023 reflects the geological opportunity within Centamin’s portfolio and the quality of its geological leadership team. The focus is now on releasing the maiden drilling campaign results in Egypt’s exploration portfolio and updating Doropo’s reserves in the ongoing DFS (Definitive Feasibility Study) by mid-2024.
Highlights of the update:
- Sukari’s Proven & Probable Mineral Reserves surged by 10% to 5.8 Moz, surpassing the 5.3 Moz estimate in the new Life of Mine Plan.
- Overall Group Proven & Probable Mineral Reserves escalated by 28% from 2022, totalling 7.7 Moz, driven by Sukari’s growth and new reserves at Doropo in Côte d’Ivoire.
- Group Measured & Indicated Mineral Resources stood at 392Mt with an average grade of 1.06 g/t for 13.4 Moz gold, reflecting growth at Doropo and depletion at Sukari.
- Doropo’s M&I Mineral Resources rose by 23% to 77Mt at 1.26g/t for 3.1 Moz gold after completing the DFS drill program.
Sukari’s stable production and falling costs
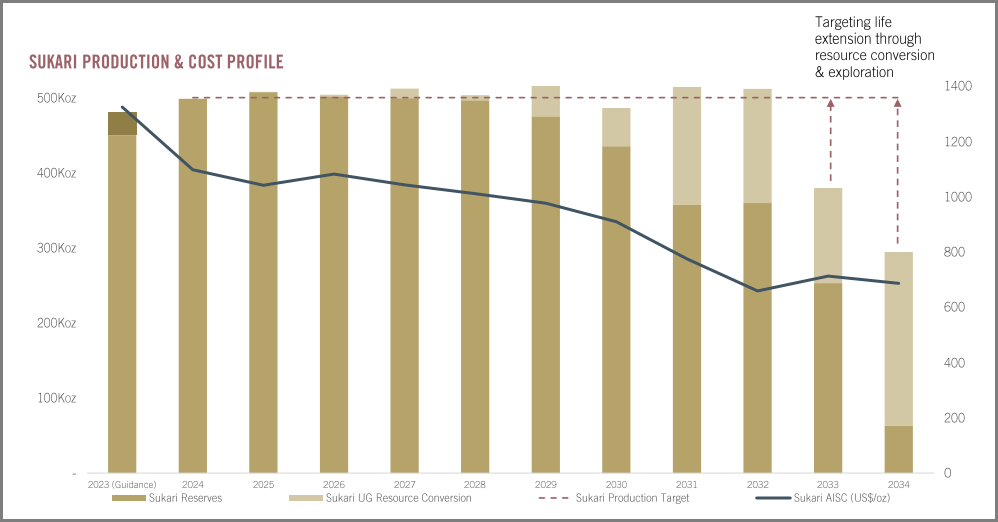
Outlook and future plans
Centamin’s 2024 geological program is all about growth. They’re planning a massive drilling effort—285,000 meters—at Sukari. This extensive drilling aims to help plan for the short and medium term. It’s not just about digging holes; they’re using this to better understand the geology, which will help them mine more effectively.
Another part of their plan involves 10,200 meters of drilling related to their Definitive Feasibility Study (DFS). This kind of drilling focuses on confirming where they can put essential infrastructure. It’s like a double-check to make sure the spots chosen are actually good for building things like mine facilities.
They’re also following up on a previous 16,000-meter drill campaign in the Eastern Desert Exploration (EDX) region in Egypt. Now that they have some data, they’re analyzing it to figure out what to do next. This follow-up work is meant to explore and identify more potential areas to mine. These plans show Centamin’s dedication to growing their resources and improving how they mine for the future.
Substantial discount to Fair Value
Centamin is trading at a forward price to earnings (PE) ratio of 10.4, which is considered relatively high in the Metals & Mining sector. However, the company compensates for this through its quality and a significant discount compared to its Fair Value.
In terms of quality, Centamin boasts an operating margin exceeding 20% and maintains a debt-free balance sheet with net cash totalling $96.2 million (TTM).
By employing a discounted cashflow model, Centamin’s share price is evaluated at a Fair Value of £2.14, revealing that the shares are undervalued by more than 50%. Fair Value is an estimation of the current worth of a share based on anticipated future cashflows. Although not flawless, a discount exceeding 20% from Fair Value is enough to sit up and take notice.
Centamin snap descending trendline
Centamin’s recent price action has seen the shares rally from its October lows in much the same way as the underlying gold price.
This rally has seen the shares snap the descending trendline which has been in place since the turn of the year and indicates a clear shift in short-term price momentum – creating a catalyst for our entry.
Price action in recent sessions has seen the shares pull back to the dynamic support of the volume weighted average price (VWAP) anchored to the October lows. This anchored VWAP level (purple line on chart right) is a handy level to track as it indicates the true average price of those institutions that managed to buy in at the October lows.
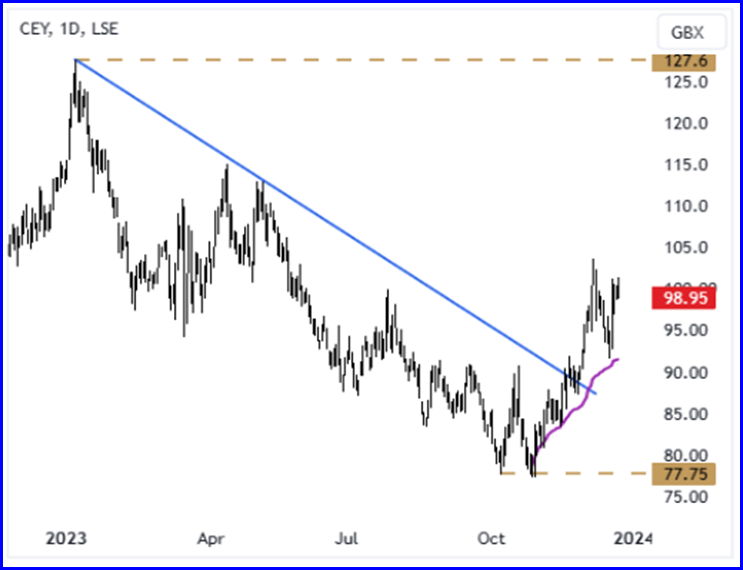
The shares now have a relative clear run ahead with the January highs at 127p being our initial target.
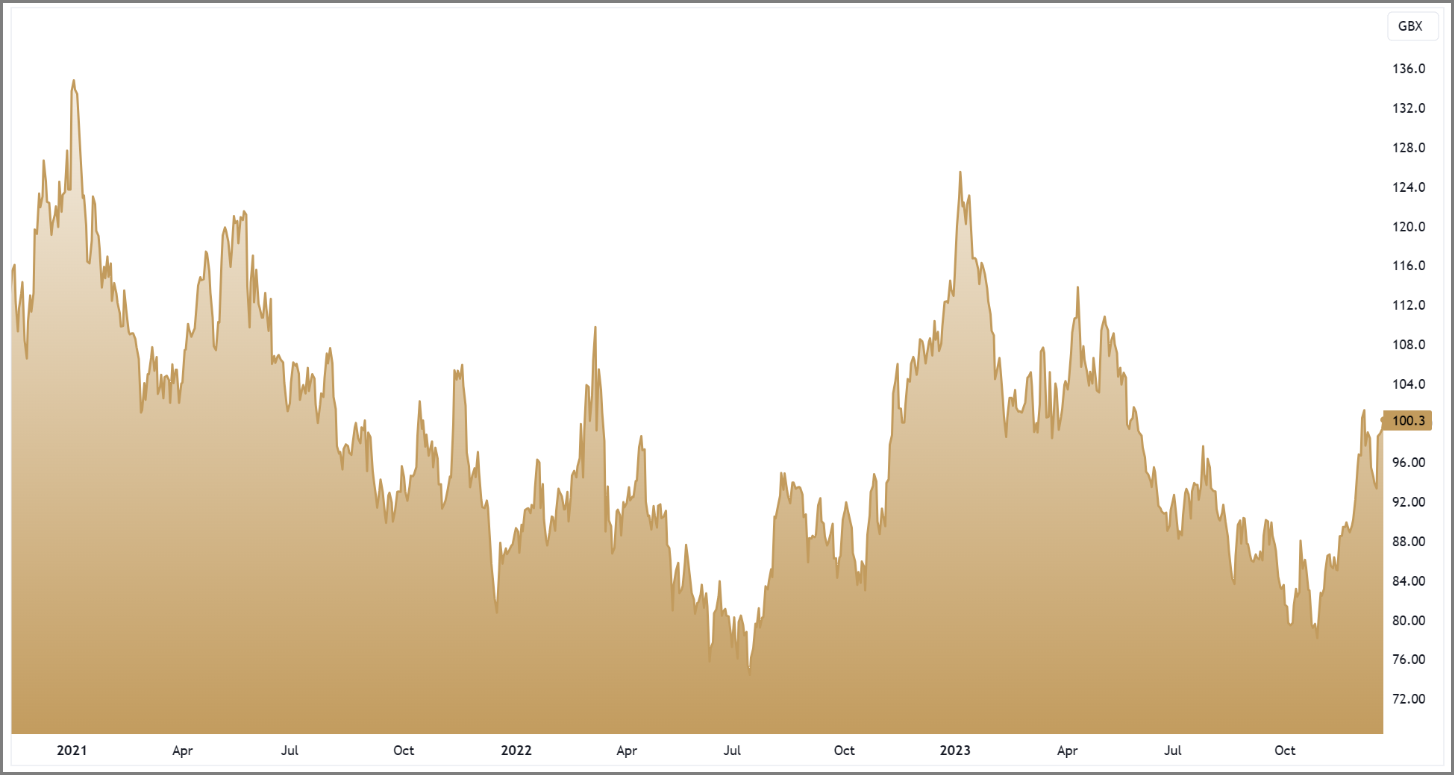
CEY 3-Year Chart
Disclaimer:
All content is provided for general information only and should not be construed as any form of advice or personal recommendation. The provision of this content is not regulated by the Financial Conduct Authority.