7th Nov 2025. 10.50am

Weekly Briefing – Friday 7th November
| Market | Movement this week (%)* |
|---|---|
| FTSE 100 | -0.30% |
| FTSE 250 | -1.47% |
| FTSE All-Share | -0.45% |
| AIM 100 | -2.52% |
| AIM All-Share | -2.42% |
* Price movement from Monday's open at 8am
Regency View:
Weekly Briefing – Friday 7th November
Market Overview
Dear Investor,
This week has seen some key tie ups in the AI space. What started as a contest to build smarter models is now becoming a race to secure infrastructure, partnerships and market share…
Amazon took centre stage after its shares jumped to record highs on news of a major agreement with OpenAI. The seven-year deal, worth an estimated $38bn will see the ChatGPT maker use Amazon Web Services for cloud computing and access to Nvidia chips. For Amazon, this is a clear victory in the battle for AI infrastructure and a sign that its huge investments in data centres are beginning to pay off. It also reduces OpenAI’s dependence on Microsoft, giving Amazon a stronger foothold in the most lucrative part of the technology stack.
Later in the week, Snap grabbed attention with a $400m partnership with Perplexity AI, a startup focused on conversational search. The agreement will embed Perplexity’s answer engine inside Snapchat from 2026, allowing users to ask questions and receive sourced responses without leaving the app. It is a smart move for a platform that has struggled to diversify beyond advertising. The news came alongside a solid earnings update, with revenues rising 10% year on year and losses narrowing sharply, suggesting Snap’s turnaround efforts are starting to deliver.
What is interesting about these two announcements is how different their roles in the AI ecosystem are. Amazon is building the plumbing, powering the next generation of models with its cloud capacity, while Snap is finding ways to bring AI into everyday consumer interactions. For investors, it shows how broad the opportunity set has become. The AI economy now stretches from chip makers and cloud providers to social media and search, creating multiple ways to gain exposure depending on your risk appetite and time horizon.
Wishing you a fantastic weekend,
Tom
Thomas Light – Chartered FCSI
Director of Research

Market Movers
On the rise: IMI (LSE:IMI) +5.5% on the week
IMI’s shares hit new highs this week after the engineering group reported a strong third quarter and reaffirmed its full-year outlook. The company said organic revenue rose 12% year on year in the quarter and is now 5% higher year to date, reflecting broad-based strength across its business segments. Statutory revenue grew 11% as foreign exchange movements weighed slightly on performance. Chief Executive Roy Twite said the results demonstrate the continued success of IMI’s growth strategy and “the strength of our One IMI operating model,” adding that the group remains on track to deliver its fourth consecutive year of mid-single digit organic revenue growth.
The company’s largest division, Automation, which accounted for 64% of 2024 sales, delivered an excellent performance with organic revenue up 17% in the quarter and 8% higher year to date. Within this, Process Automation saw particularly strong momentum, with third-quarter organic revenue rising 26% and 14% higher year to date, supported by rising global energy demand and high-margin aftermarket orders. Industrial Automation also delivered 2% organic growth, benefitting from catch-up shipments following a first-quarter cyber incident.

In its Life Technology division, which represents 36% of group sales, organic revenue rose 4% in the third quarter and 1% year to date. Climate Control achieved 5% organic growth as demand for energy-efficient building solutions and data centre cooling systems increased, while Life Science and Fluid Control rose 13%, reflecting improved demand and delayed shipments from earlier in the year. The Transport sector saw a 9% decline, consistent with global weakness in heavy-duty truck markets, with a strategic review of the segment ongoing. IMI reaffirmed full-year guidance for adjusted earnings per share between 129p and 136p, with results for the year ending 31 December 2025 due to be published on 6 March 2026.
REGENCY VIEW:
IMI continues to fire on all cylinders, delivering consistent growth underpinned by high returns on capital and impressive execution across its divisions. With an ROE of 23.8% and forecast EPS growth of 8.3%, this is a company that’s clearly in control of its momentum and showing the kind of industrial discipline investors like to see.
Shares in Hikma Pharmaceuticals fell sharply on Thursday after the company reaffirmed its 2025 guidance but revised down its medium-term profit growth outlook. The London-listed drugmaker said it continues to expect group revenue to rise between 4% and 6% this year, with core operating profit now forecast in the range of $730 million to $750 million, narrowing from the previous upper range of $770 million. The update came as the firm reported steady progress across its main divisions, highlighting new product launches and expansion projects throughout its global manufacturing network.
Hikma said its Injectables business, a key driver of earnings, is trading in line with expectations, supported by higher-margin contract manufacturing and accelerating sales from recent launches. The company has rolled out its second US-approved biosimilar, Starjemza, and begun the phased launch of Tyzavan, a patented reformulation of vancomycin. The group expects Injectables revenue growth of 7% to 9% in 2025, with margins between 32% and 33%. Meanwhile, its Branded division, which serves markets across the Middle East and North Africa, is seeing continued strength from oncology and chronic disease treatments, including Papillio for breast cancer and Dapa for diabetes. Revenue in the Branded segment is expected to grow between 6% and 7%, with a core EBIT margin close to 25%.

The company also announced structural changes aimed at accelerating innovation, including the centralisation of global R&D under Hafrun Fridriksdottir, who will continue to lead the Hikma Rx business. However, Hikma trimmed its medium-term profit expectations, now forecasting group core operating profit growth of 5% to 7% between 2024 and 2027, down from the prior 7% to 9% range. The company attributed the revision to delays in ramping up its new Bedford manufacturing site and increased investment in research and development. Despite the adjustment, Hikma maintained its longer-term goal of reaching $5 billion in annual revenue by 2030.
REGENCY VIEW:
Hikma is starting to fall out of favour with investors, but the valuation is becoming increasingly appealing. The shares now trade on a forward P/E of 9.3 with forecast earnings growth of 12.3% and a dividend yield of 3.8%, leaving the business looking well supported by strong cash generation and a healthy balance sheet.
Sector Snapshot
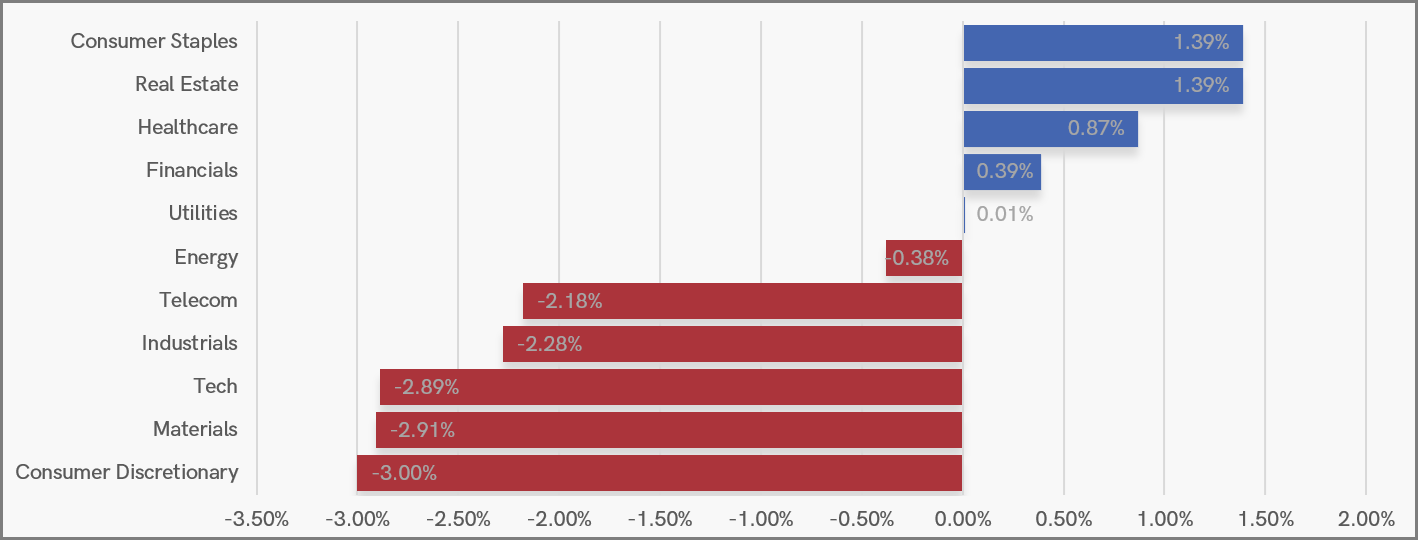
This snapshot covers the past seven trading days, so it’s not an exact reflection of this week’s moves but still gives a clear picture of where the strength and weakness have been. Defensive sectors led the way, with Consumer Staples and Real Estate posting solid gains, while Healthcare and Financials also managed to stay in positive territory. Utilities were broadly flat, helping to steady the market as cyclical sentiment cooled.
On the downside, Consumer Discretionary, Materials and Tech were the weakest performers, joined by Industrials and Telecom in negative territory. Energy also slipped slightly, rounding out a week where investors favoured stability over growth and cyclical exposure.
UK Sector Performance (7-Days)
UK Price Action
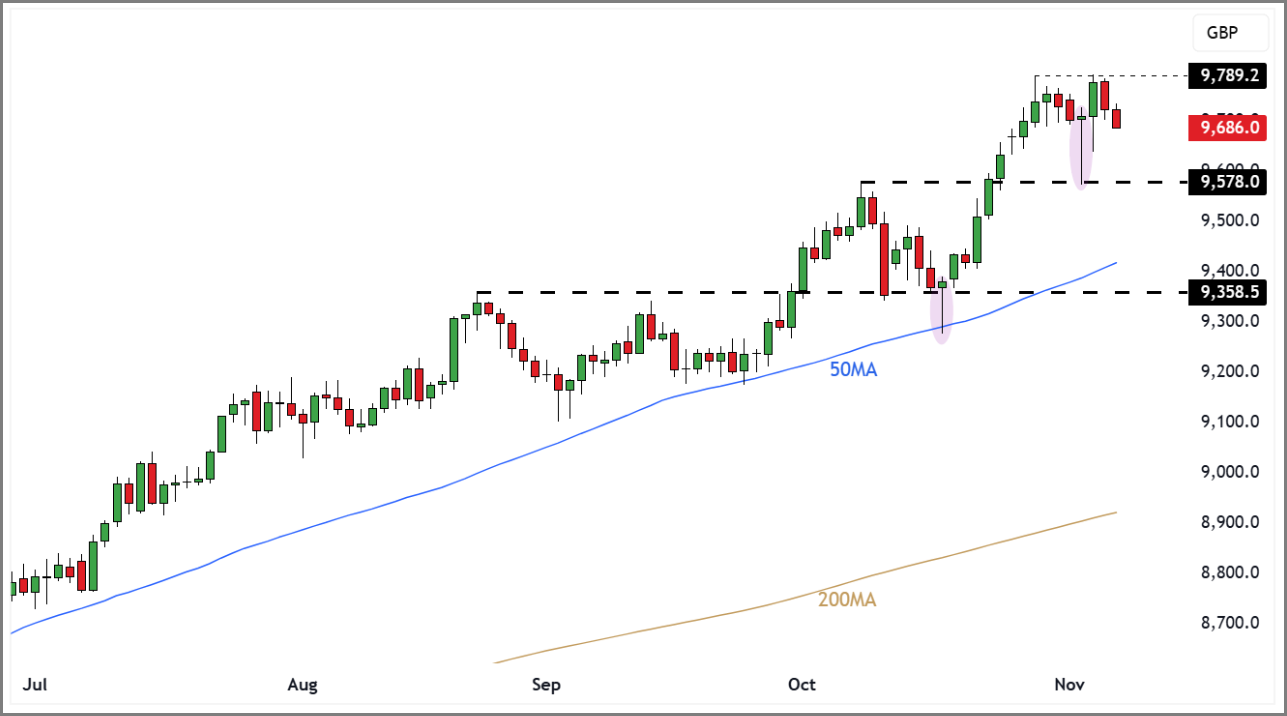
It’s been a whipsaw week for the FTSE. After pulling back to support, the market quickly attracted buyers, forming another bullish pin-bar candle. However, unlike the previous pin-bar, this one has so far seen far less follow-through, with price stalling beneath swing resistance.
This hesitation suggests the index may need to consolidate before attempting another push higher. As long as the market holds above 9,580 support, the broader uptrend remains intact, but a break below that level would increase the risk of a deeper retracement toward the 50-day moving average.
FTSE 100 Rolling Futures (Daily Candle Chart)
Disclaimer:
All content is provided for general information only and should not be construed as any form of advice or personal recommendation. The provision of this content is not regulated by the Financial Conduct Authority.