


26th Jun 2026. 11.04am

Weekly Briefing – Friday 26th June
| Market | Movement this week (%)* |
|---|---|
| FTSE 100 | +0.88% |
| FTSE 250 | -1.06% |
| FTSE All-Share | +0.65% |
| AIM 100 | -4.65% |
| AIM All-Share | -3.95% |
* Price movement from Monday's open at 8am
Regency View:
Weekly Briefing – Friday 26th June
Market Overview
Dear Investor,
It has been one of those weeks where the headlines suggested markets should have been far more unsettled than they actually were.
A Prime Minister resigned, the Bank of England delivered a more hawkish message than many had expected, and developments in the Middle East continued to reshape energy markets. Individually, each of those events would normally be enough to dominate investor attention. Instead, markets largely took them in their stride.
Perhaps that tells us something about the mood today. Investors seem increasingly willing to look through short-term noise and ask a much simpler question: does any of this materially change the outlook for company earnings? Political uncertainty undoubtedly creates fresh questions for the UK, particularly around fiscal policy and the timing of the next Budget. Likewise, two Bank of England policymakers voting for higher interest rates is a reminder that inflation has not completely disappeared. Yet neither development was enough to trigger the sort of broad market sell-off that might once have been expected.
Meanwhile, the continued decline in oil prices following the US-Iran agreement is quietly changing the backdrop once again. Only a few weeks ago, investors were worrying about another inflation shock. Today, lower energy prices are easing some of those concerns, even if they have taken some of the shine off the oil majors that dominate the FTSE 100.
One of the biggest lessons in investing is that markets don’t react to headlines, they react to whether those headlines genuinely change the outlook. This week was a useful reminder that the two are often very different things.
Wishing you a great weekend,
Tom
Thomas Light – Chartered FCSI
Director of Research

Market Movers
On the rise: Halfords (LSE:HFD) +21.9% on the week
Halfords climbed this week after delivering annual results ahead of expectations and issuing an upbeat outlook for the year ahead, suggesting its turnaround strategy is beginning to gain traction.
Underlying profit before tax came in at £45.4m, comfortably ahead of analyst forecasts, while management said it expects profit growth in the current financial year to come in towards the top end of market expectations. Despite ongoing pressure on consumer confidence, the retailer said it has yet to see any meaningful deterioration in customer spending, although it acknowledged that any impact from recent geopolitical uncertainty may become more apparent later in the year.

The improvement reflects more than just resilient trading. Halfords has spent the past two years simplifying the business, improving pricing discipline and placing greater emphasis on its higher-margin motoring services business, including garages, servicing and repair work. That shift is helping reduce reliance on discretionary cycling sales while creating a steadier, more recurring revenue base.
Regency View: Halfords has quietly become one of the UK’s strongest momentum stories in recent weeks, with the shares now trading at fresh 52-week highs. Valuation still looks undemanding at around 13 times forward earnings, suggesting the market is only just beginning to recognise that this is becoming a turnaround story rather than a recovery trade.
Telecom Plus suffered one of the biggest falls in the FTSE 250 this week after unveiling an ambitious five-year growth strategy that comes at a significant short-term cost to profits.
The Utility Warehouse owner said it plans to invest around £55m a year over the next five years as it looks to double its higher-value multiservice customer base to more than one million by 2031. The strategy includes more competitive pricing, greater investment in its partner sales network, increased brand marketing and a major push into digital services and AI. While management believes the plan will ultimately create a larger, more resilient business, it warned that adjusted profit before tax is expected to fall to between £80m and £90m this year, well below the £132m delivered in the previous financial year.

Investors appeared to focus on the near-term earnings hit rather than the longer-term opportunity. Although management highlighted encouraging early results from its pilot programmes and is targeting adjusted profit before tax of around £175m by 2031, the market was clearly disappointed by the scale of the investment required and the length of time before shareholders are expected to see the benefits.
Regency View: There is a fine line between investing for growth and asking investors to wait patiently. If management delivers on its plan today’s sell-off may eventually look like an overreaction, but for now the market seems unwilling to sacrifice £1 of profit today for the promise of £2 tomorrow.
Sector Snapshot
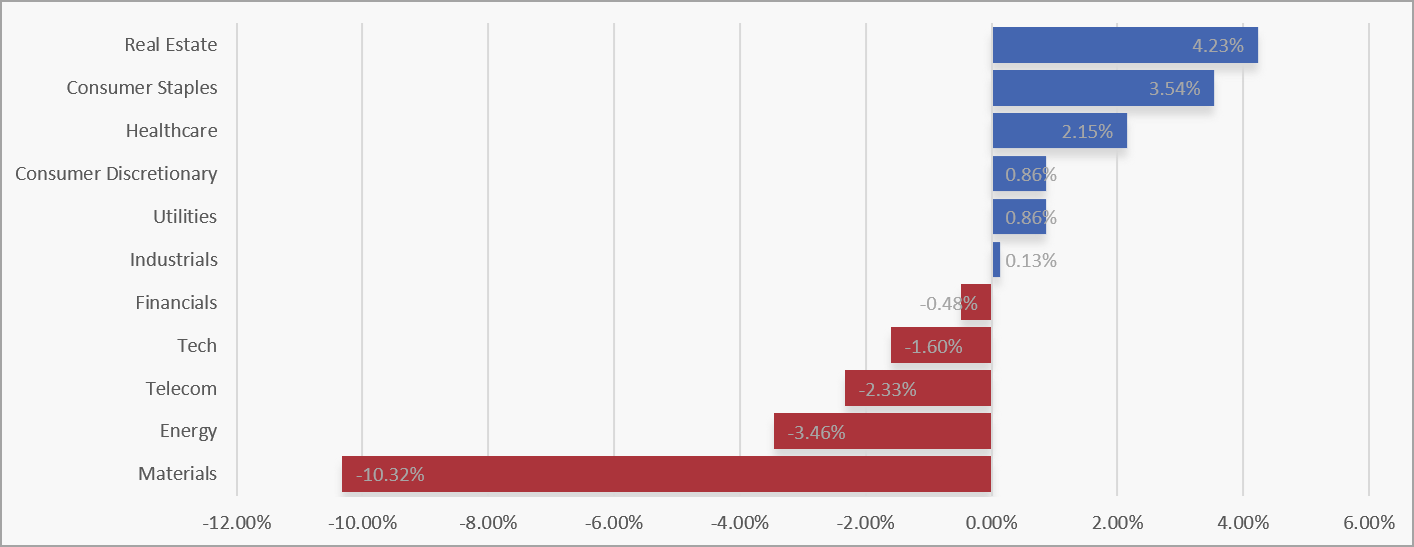
Real Estate led the market this week, with Consumer Staples and Healthcare also posting strong gains as investors rotated back towards more defensive areas. Utilities edged higher alongside Consumer Discretionary, while Industrials were broadly unchanged, pointing to a more cautious tone after last week’s cyclical rally.
At the weaker end, Materials suffered a particularly sharp decline, giving back a significant portion of their recent gains. Energy and Telecoms also came under pressure, while Tech continued to drift lower and Financials edged into negative territory. The rotation suggests investors are once again prioritising earnings resilience and stability over economically sensitive sectors.
UK Sector Performance (7-Days)
UK Price Action
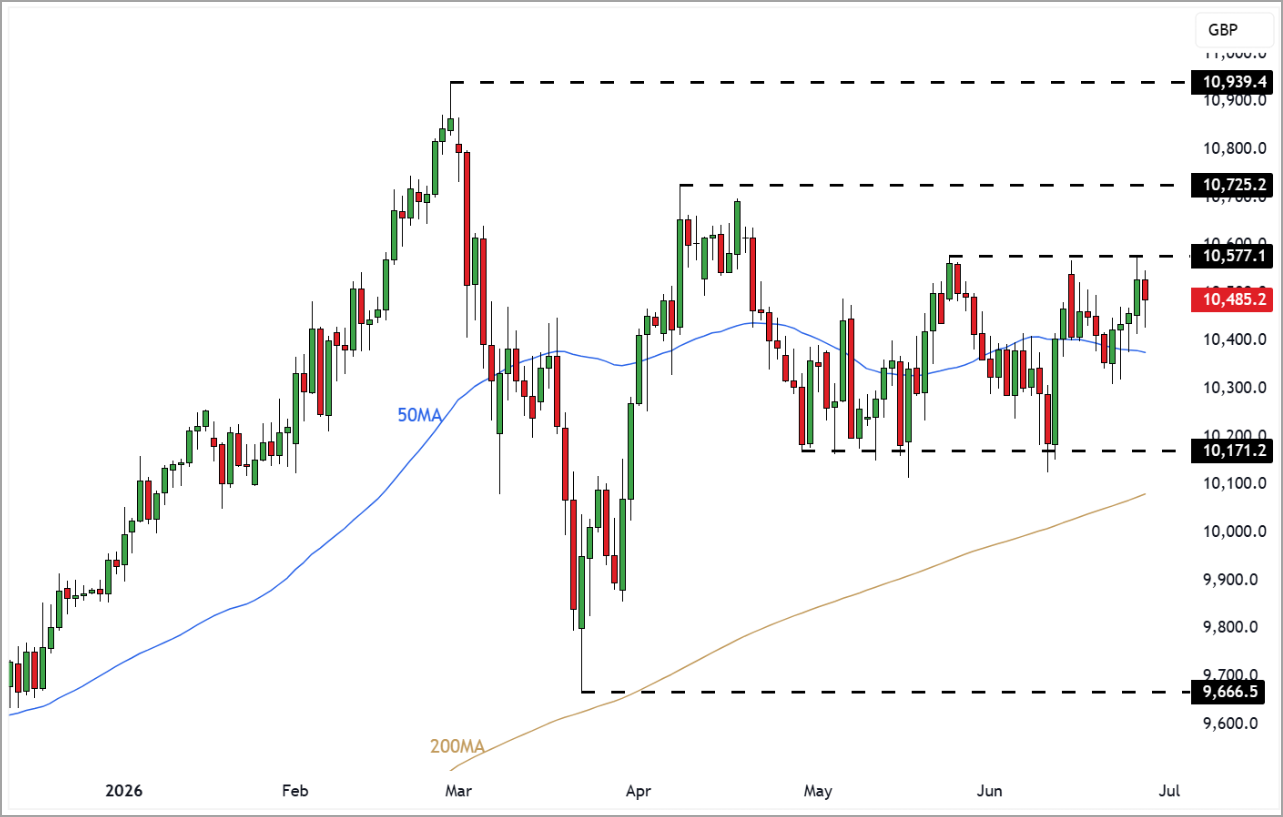
It’s been a mildly bullish week for the FTSE, with the market reclaiming the 50 day moving average and pushing back towards swing resistance around 10,575. That keeps the recent range intact, but it’s another small positive after several weeks of indecisive trading. Buyers have gradually regained control from the lower end of the range, although they have yet to deliver the decisive breakout needed to shift the bigger picture.
The next test is now clear. A convincing break above resistance would complete the range breakout and could open the door for a move towards the March highs. If the market stalls here once again, however, it would reinforce the view that the FTSE remains locked in consolidation. For now, the balance has tilted slightly back in favour of the bulls, but they still have work to do before they can claim control of the longer term trend.
UK100 Daily Candle Chart
Disclaimer:
All content is provided for general information only and should not be construed as any form of advice or personal recommendation. The provision of this content is not regulated by the Financial Conduct Authority.