16th May 2025. 10.50am

Weekly Briefing – Friday 16th May
| Market | Movement this week (%)* |
|---|---|
| FTSE 100 | +1.15% |
| FTSE 250 | +2.12% |
| FTSE All-Share | +1.56% |
| AIM 100 | +1.49% |
| AIM All-Share | +1.54% |
* Price movement from Monday's open at 8am
Regency View:
Weekly Briefing – Friday 16th May
Market Overview
Dear Investor,
After a turbulent start to the year, the S&P 500 has staged a comeback that’s caught more than a few seasoned investors off guard. Momentum has built steadily in recent weeks, with the index reclaiming its 200-day moving average, one of those quietly important technical levels that tends to draw in both traders and long-term money once it’s back in play.
This turnaround hasn’t come out of nowhere, but the pace has certainly surprised. The trigger was the easing of trade tensions between the US and China, a temporary agreement to cut tariffs that helped lift the weight pressing on global sentiment. That shift alone was enough to unwind a host of defensive positions, with funds scrambling to cover bearish bets on both equities and the dollar. A classic example of positioning driving price as much as the data itself.

But it’s not just about short-term flows. Beneath the surface, there’s a broader narrative forming. Yes, the US economy is slowing, but not as abruptly as many had feared. And that nuance matters. Bond markets had started to price in a more severe downturn, but recent data, while not booming, has come in less bleak than expected. That’s been enough to drag long-dated yields higher again, unravelling the recession trades and nudging investors back towards equities.
There’s also been a noticeable shift in who’s doing the buying. Retail investors, often quicker to take the plunge when markets are shaky, were active buyers throughout April. But now institutional money is catching up. When both are swimming in the same direction and the charts are lining up with the macro, it tends to reinforce the move. Whether you follow technicals religiously or not, the 200-day moving average has a way of drawing attention. It’s not magic, but it can be self-fulfilling.
Wishing you a fantastic weekend,
Tom
Thomas Light – Chartered FCSI
Director of Research

Market Movers
On the rise: Burberry (LSE:BRBY) +26.6% on the week
Burberry’s share price has jumped higher this week following the release of its full-year results on Wednesday, which signalled early signs of progress in the group’s turnaround strategy despite a sharp drop in profits.
While the headline figures were undeniably weak, with revenue down 17% year-on-year and adjusted operating profit plunging by 94%, investors were encouraged by the company’s improved performance in the second half of the year and growing signs that the new strategic plan, Burberry Forward, is starting to gain traction. Comparable store sales improved from a 20% decline in the first half to just 5% lower in the second half, aided by stronger brand sentiment, refreshed store merchandising, and new campaigns like “It’s Always Burberry Weather” and “Wrapped in Burberry.”
The group also surprised with a positive free cash inflow of £65 million and announced further cost savings initiatives, including a new £60 million programme expected to take total annualised savings to £100 million by FY27. Although this includes significant restructuring, with potential job reductions affecting up to 1,700 roles globally, the market viewed these steps as evidence of management’s determination to restore profitability and sharpen focus on core strengths like outerwear and scarves.
CEO Joshua Schulman struck an upbeat tone, pointing to improved customer engagement and the company’s renewed identity as a Timeless British Luxury brand. With a runway show at Tate Britain and a clearer product strategy now in place, the market seems willing to look beyond the tough comparatives and weak current-year earnings in anticipation of a stronger FY26 performance.
REGENCY VIEW:
Burberry’s luxury brand appeal isn’t enough to hide the cracks. Profits have collapsed, margins are underwater, and the balance sheet is looking stretched with rising debt and falling book value. The recent bounce off the lows is promising short-term, but with no dividend and minimal earnings visibility, long-term conviction remains low until the turnaround shows signs of life.
Imperial Brands’ share price has pulled back from recent highs despite solid half-year results due to a mix of factors.
While the company delivered steady revenue growth in tobacco and Next Generation Products (NGP), strong pricing offsetting volume declines, and a 6% increase in adjusted earnings per share, the overall reported revenue actually fell 3.1%, mainly due to volume declines in high excise markets and adverse foreign exchange impacts. Operating profit was also down slightly on a reported basis, reflecting currency headwinds.
More importantly, the outlook signals some uncertainty tied to the global economic environment and ongoing FX pressures. The company expects foreign exchange translation to weigh on net revenue and adjusted operating profit by around 2-4.5% this year. Additionally, while adjusted operating profit is set to grow mid-single digits at constant currency, these currency effects and continued volume declines in tobacco likely dampen investor enthusiasm.

Investors might also be cautious about the longer-term growth prospects given the gradual volume declines in combustible tobacco and the need to invest heavily in NGP to build a sustainable business. Despite strong cash flow and generous shareholder returns – including a £1.25 billion share buyback and a 78.5% interim dividend increase – the mix of slower top-line growth, currency headwinds, and ongoing investment costs could be weighing on the share price.
In short, the share price retreat likely reflects a “wait and see” stance from the market, balancing Imperial’s robust cash generation and capital returns against uncertain revenue growth, currency pressures, and the evolving tobacco market dynamics.
REGENCY VIEW:
Imperial Brands offers high free cash flow and a forecast dividend yield of over 6%, underpinned by robust profitability all at a forward P/E of just 8x. While recent price momentum has faded, the stock still screens well for value and income, with scope for rerating if earnings growth continues.
Sector Snapshot
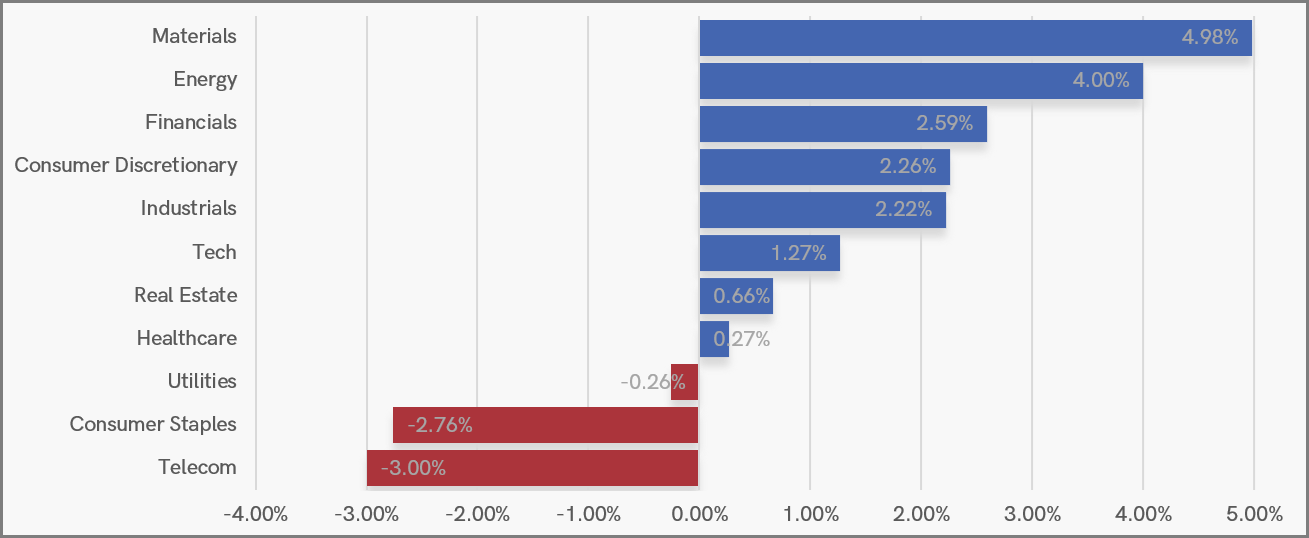
Materials and Energy topped the leaderboard as commodity-linked names caught a fresh bid, while Financials and Industrials also gained ground on signs of improving macro sentiment.
At the other end, Telecoms and Consumer Staples came under pressure, with Utilities slipping modestly too. Despite the headline index treading water, the underlying sector rotation continues to build momentum, pointing to a market increasingly willing to bet on growth and pricing power.
UK Sector Performance (YTD)
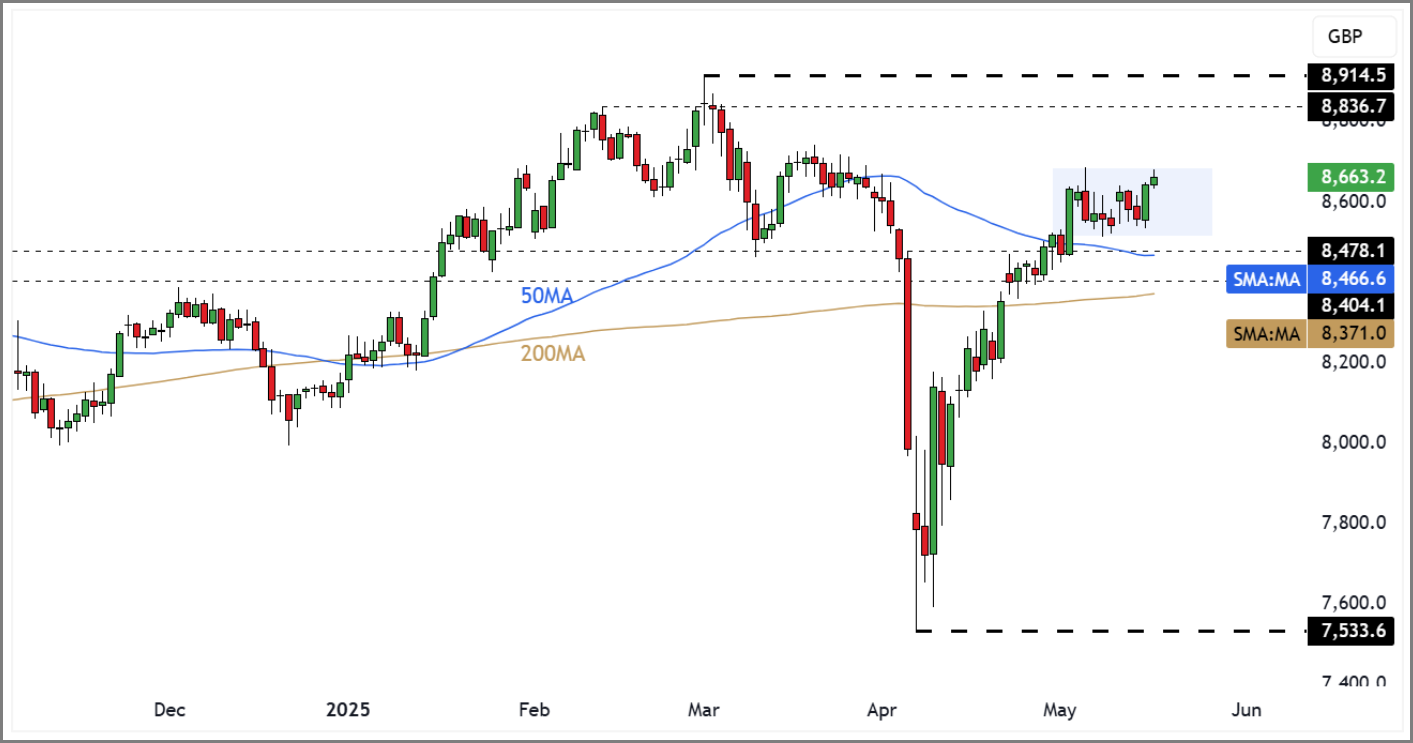
UK Price Action
We’ve seen a second week of sideways consolidation for the FTSE with volatility contracting. We can you the mini-range that is developing to time short-term positions on the index. For long-term investors this consolidation near recent highs signals underlying strength.
FTSE 100 Rolling Futures (Daily Candle Chart)
Disclaimer:
All content is provided for general information only and should not be construed as any form of advice or personal recommendation. The provision of this content is not regulated by the Financial Conduct Authority.