
Regency View:
Update
JD rally as new CEO unveils growth plans
“We see significant growth opportunities ahead by expanding JD internationally, notably in North America and Europe”.
The words of new JD Sports (JD.) CEO, Régis Schultz as he addressed investors at last week’s Capital Markets Day.
Mr Schultz, who took the helm last year, said he wanted to turn JD Sports into a “global sports-fashion powerhouse”.
JD will invest up to £3bn to open as many as 1,750 stores worldwide with Schultz targeting “double digit revenue growth” and “double-digit operating margins”.

The market responded very positively to Schultz’s growth plans and JD’s share price surged higher last Thursday.
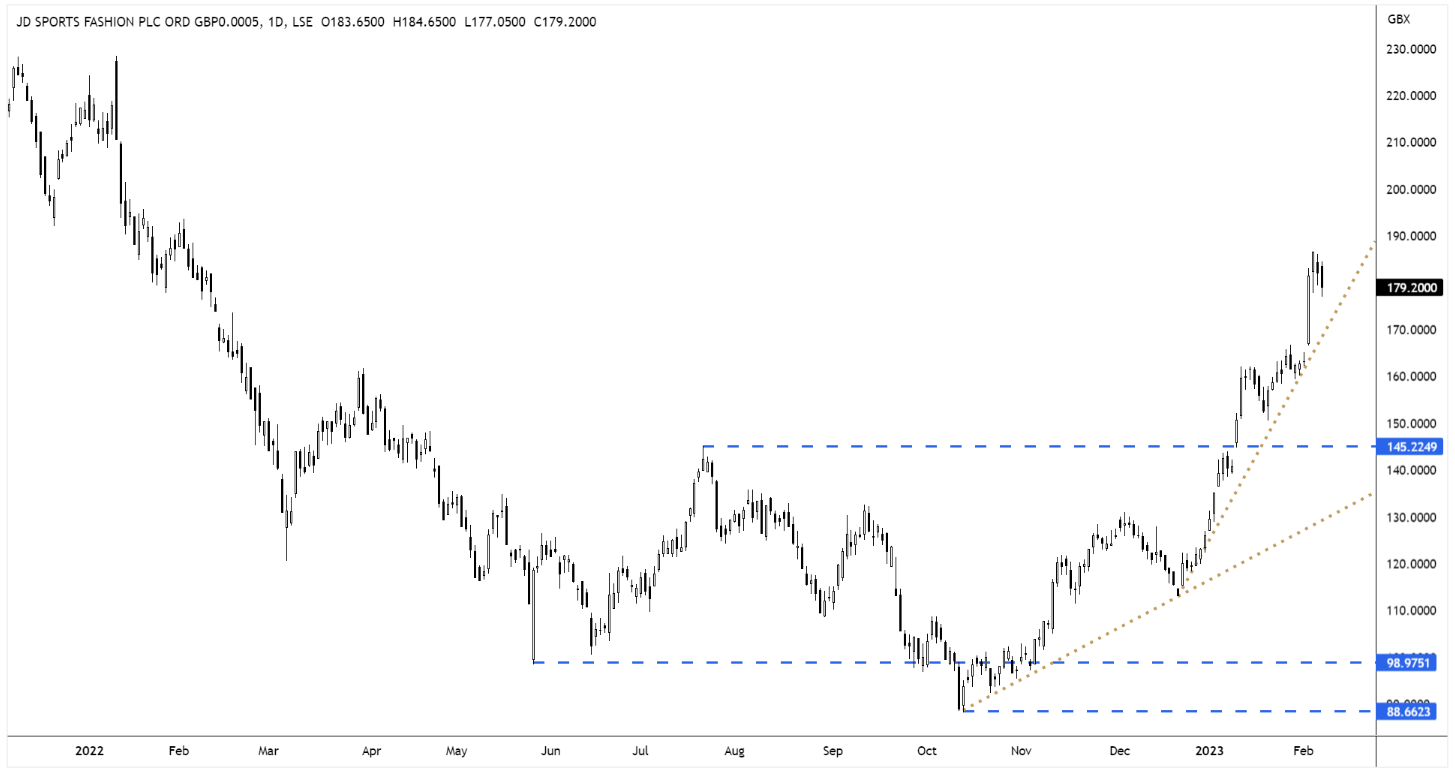
Short-term price momentum is very strong and the shares are now trading back at pre-pandemic levels, but remain more than 25% below their November 2021 highs.
JD. Daily Candle Chart
Halma buys Bradford’s Thermocable for £22m
Halma (HLMA) has announced its acquisition of Thermocable (Flexible Elements) Ltd for its fire detection company, Apollo Fire Detectors.
Thermocable is based in Bradford and is a leading developer and manufacturer of Linear Heat Detectors (LHDs). LHDs are temperature sensitive cables, installed in areas at risk of overheating and fire, which trigger an alert when they detect a change of temperature. Thermocable’s specialist detection technologies will expand the range of devices Apollo offers.
Halma CEO, Andrew Williams said:

“Thermocable will enable Apollo to address a greater range of customer needs in niche applications for a variety of sectors such as urban infrastructure and transportation, logistics, natural resources and emerging applications in renewable power generation.”
The initial consideration for Thermocable is £22m, on a cash and debt-free basis, which will be funded from Halma’s existing facilities. Thermocable’s unaudited revenue for the 12 months to 31 March 2022 was £6.3m, with Return on Sales substantially above the upper end of Halma’s target range of 18-22%.
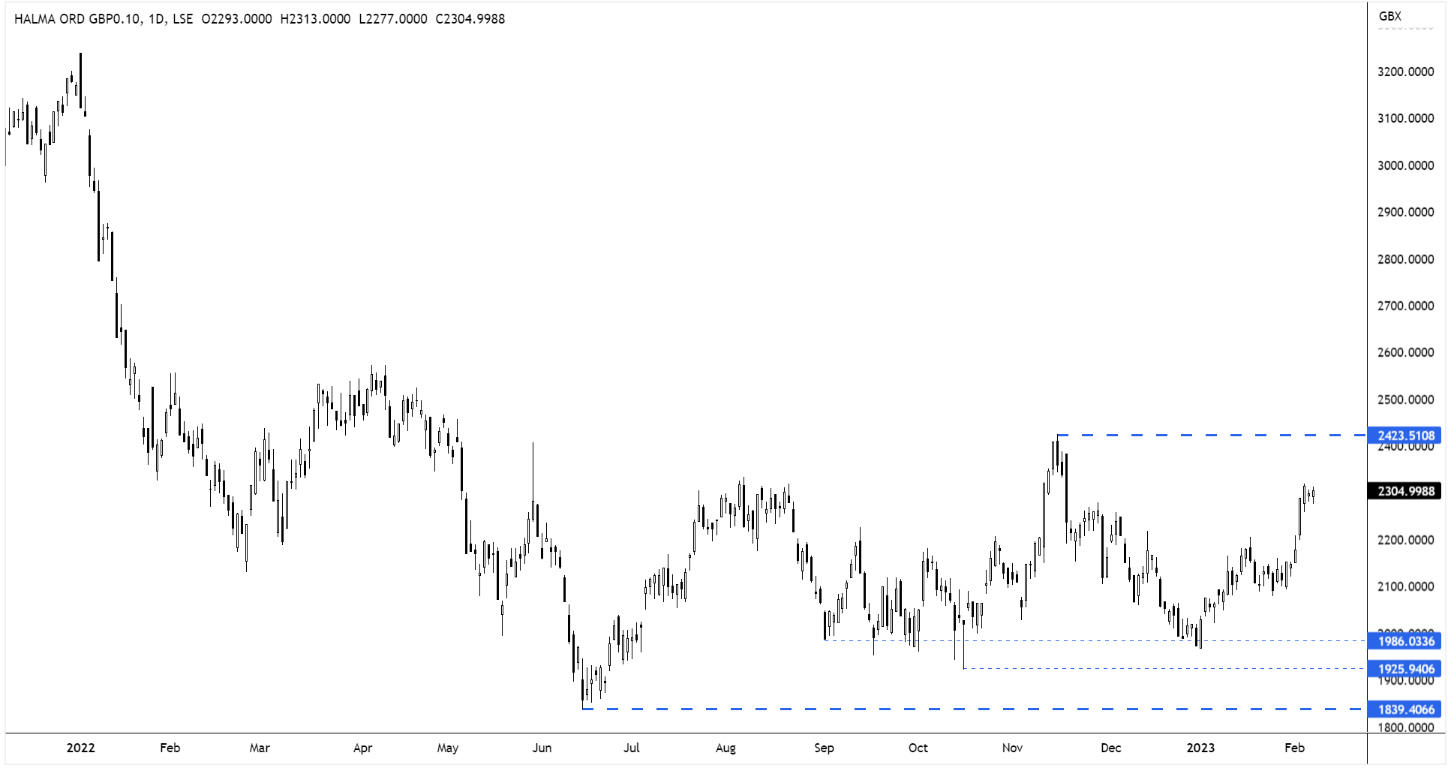
HLMA Daily Candle Chart
AstraZeneca earnings preview
AstraZeneca (AZN) are set to publish Q4 2022 earnings on Thursday 9th February.
The pharma giant is expected to report a 6.3% decrease in revenue to $11.258bn from $12.01bn a year ago, according to the mean estimate from 4 analysts, based on Refinitiv data.
AstraZeneca upgraded guidance in November last year, after it returned to profitability in the third quarter. Refinitiv’s mean analyst estimate for AstraZeneca is for earnings of 67 cents per share.

In recent months AstraZeneca has managed to get European regulatory approval for its Enhertu, Imfinzi and Lynparza drugs, as well as securing two separate deals to enhance its respiratory disease offering – a partnership with C4X Discovery and the acquisition Neogene Therapeutics.
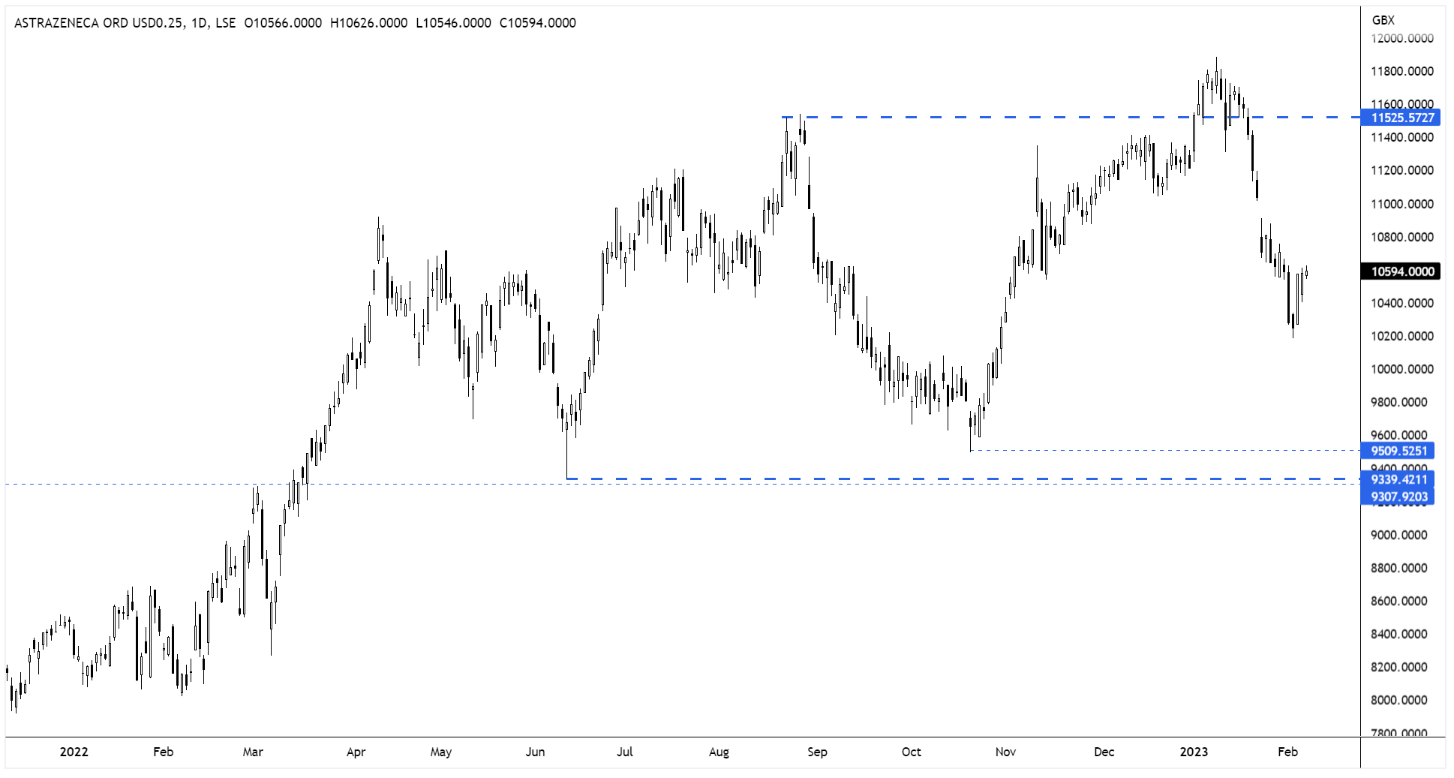
The shares broke to new highs at the turn of the year, but the breakout failed and prices have retraced more than 10%.
We will cover the earnings release in our next FTSE Investor Update.
AZN Daily Candle Chart
Morgan warns cyber attack will dent full year profits
Morgan Advanced Materials (MGAM) warned on Tuesday that full-year operating profits will be below previous expectations as it continues to manage the consequences of a cyber security attack which took place in January.
The smart materials group said it remains “challenging” to estimate precisely the extent of any impact on its interim trading after a number of sites experienced a delay in restarting production and shipping due to the cyber security attack.
Exceptional costs associated with the incident were said to potentially amount to approx. £8m-12m.

However, Morgan said revenue growth remained “robust” in the final two months of the year, with revenue expected to be around £1.1bn, representing growth of 16% or 11% at constant currency. Adjusted operating profit was expected to be “slightly above” the top-end of forecasts.
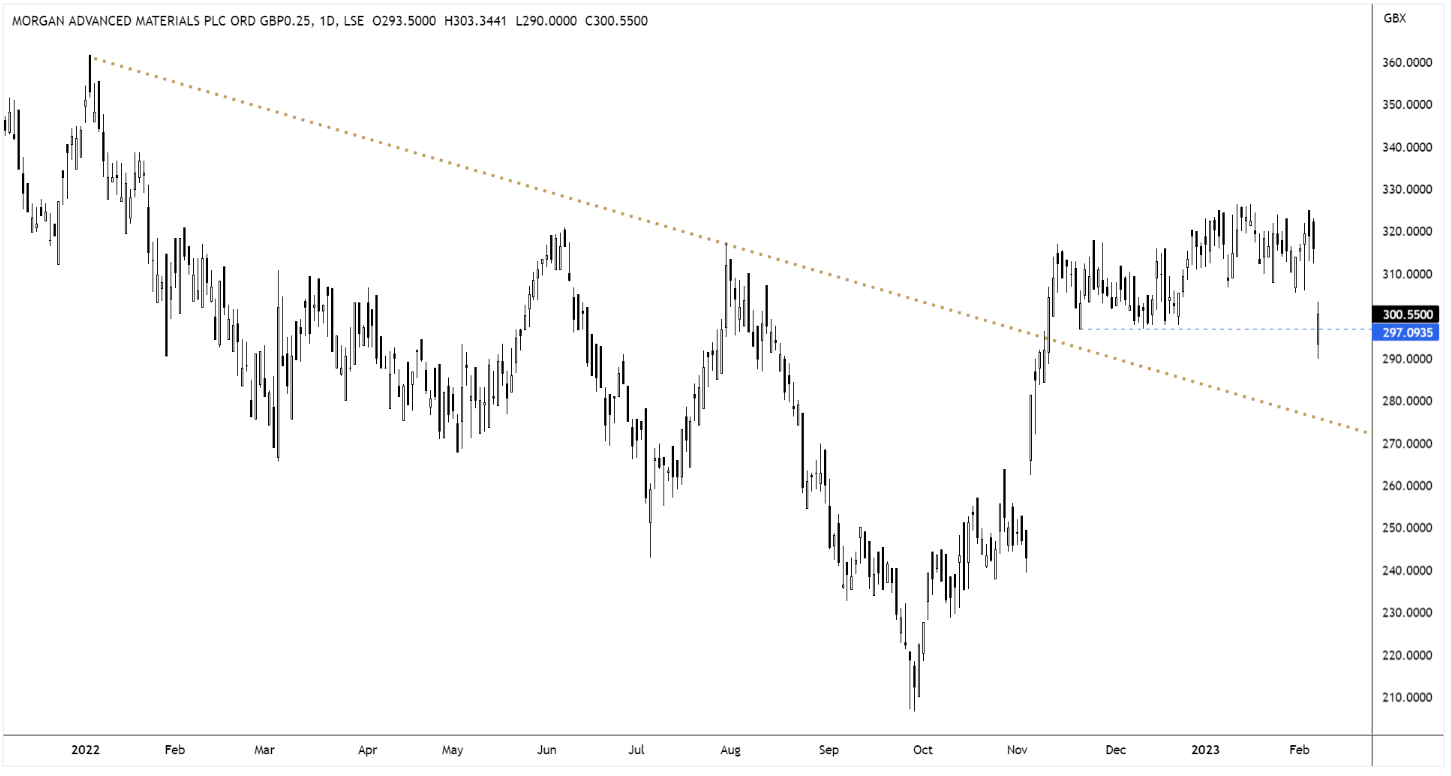
The shares gapped lower on Tuesday’s update, but have since regained some of their losses with prices bouncing from short-term support.
MGAM Daily Candle Chart
Disclaimer:
All content is provided for general information only and should not be construed as any form of advice or personal recommendation. The provision of this content is not regulated by the Financial Conduct Authority.