20th May 2026. 9.03am

Regency View:
Update
Regency View:
Update
This week’s update reflects a market still willing to reward operational execution, but also one becoming increasingly selective about what it pays for. Upgraded guidance, stronger cash generation and improving momentum have generally been met positively, while even very strong results have been punished where investors have spotted signs of slowing growth beneath the surface. The market remains in a “show me the numbers” mood.
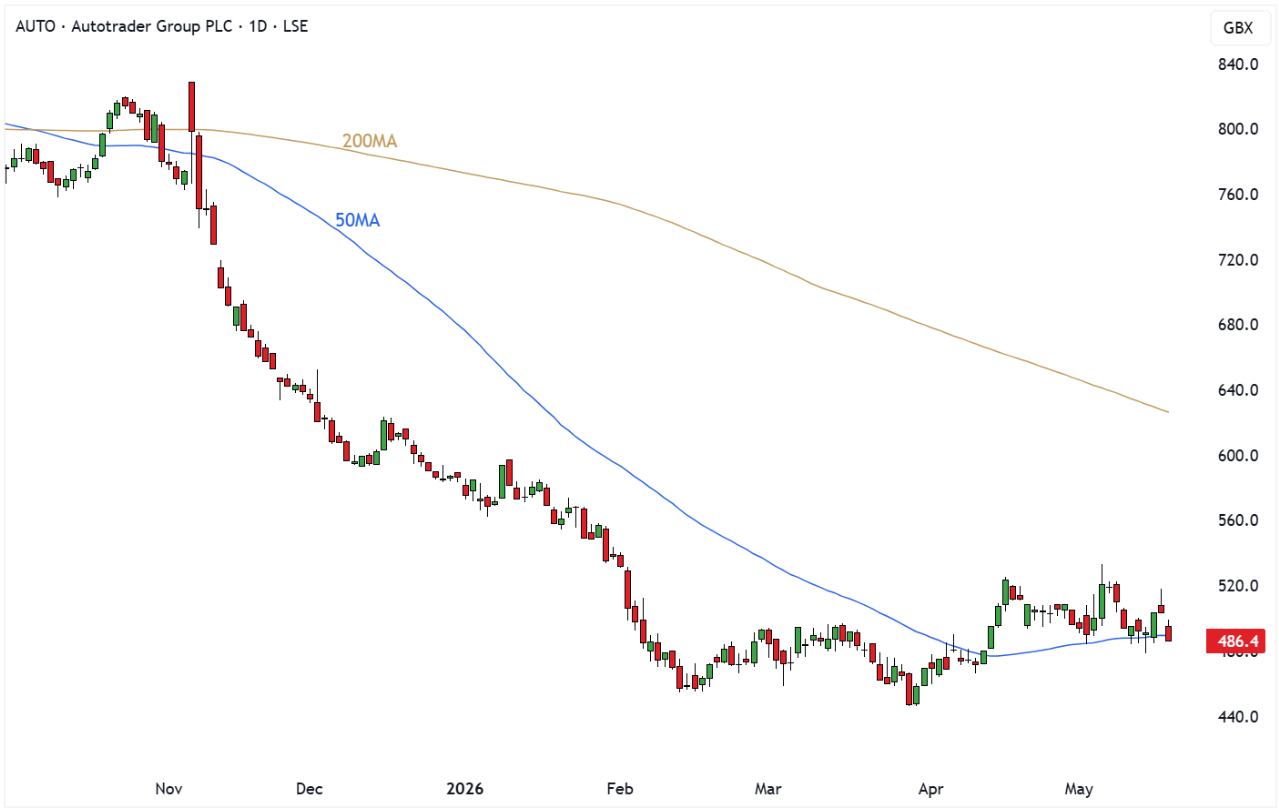
Auto Trader: Activists Pull Into the Forecourt
Auto Trader (AUTO) saw its shares move sharply higher after reports emerged that activist investor Palliser Capital had built a stake of between 1% and 2% in the business. More importantly, reports suggested Palliser may push management to return as much as £700m to shareholders alongside upcoming full year results.
The market tends to pay attention when activists arrive, particularly in businesses already generating substantial cash. Auto Trader has long been viewed as a high quality platform business with strong margins and recurring revenues, but the shares had quietly drifted lower this year despite the underlying fundamentals remaining relatively stable. Palliser appears to believe there may be more value sitting within the balance sheet than the market is currently recognising.
Investors often like these situations because they introduce a potential catalyst. Whether management chooses to engage with the suggestions or not, capital allocation suddenly becomes part of the investment debate. Sometimes activists turn up because a business is broken. In this case, it looks more like someone walking into a well run showroom and pointing at the cash sitting in the back office.
What we are watching next: shareholder return plans at full year results
Themes: Activist Investor | Capital Returns | Platform Business
AUTO Daily Candle Chart
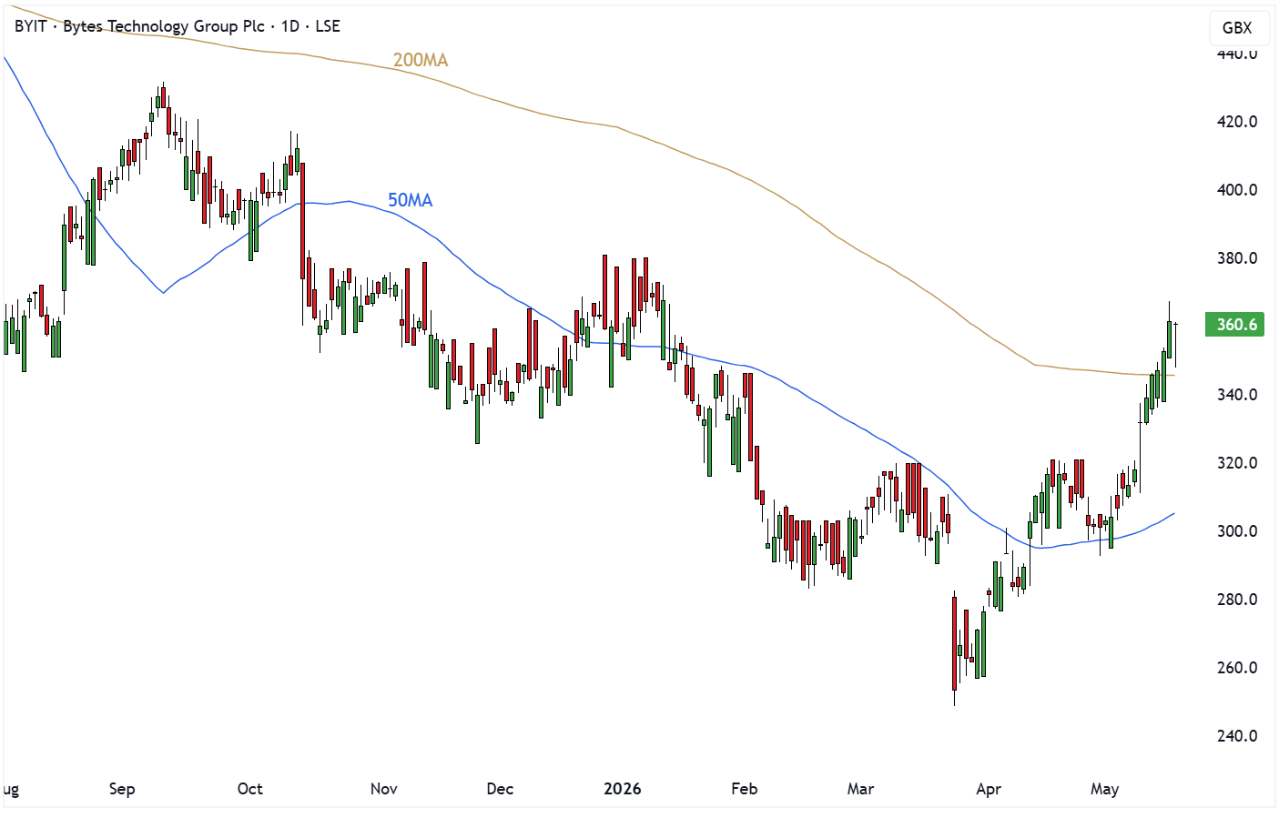
Bytes Technology Adjusting Today for Tomorrow
Bytes Technology (BYIT) delivered a slightly mixed set of results, where strong underlying demand was partly obscured by temporary operational changes and investment spending.
Gross invoiced income increased by 11.5% to £2.34bn and services growth remained particularly strong, while gross profit improved 2.5%. However operating profit fell 5.6% as the company absorbed the impact of Microsoft incentive changes alongside investment into sales teams and future growth initiatives. The market initially focused on the softer profitability metrics rather than the broader picture.
Underneath the surface though, the update looked healthier than the headline numbers suggested. Existing customer retention remained exceptionally high at 99%, growth accelerated during the second half and management highlighted strong momentum continuing into the early part of FY27. AI also increasingly looks like an opportunity rather than simply another technology buzzword, with Bytes positioning itself as a key partner helping customers adopt emerging AI solutions. The business appears to have spent the past year laying foundations rather than simply maximising short term profits.
What we are watching next: margin recovery and AI driven services growth
Themes: Full Year Results | AI | Software | Cloud Services
BYIT Daily Candle Chart
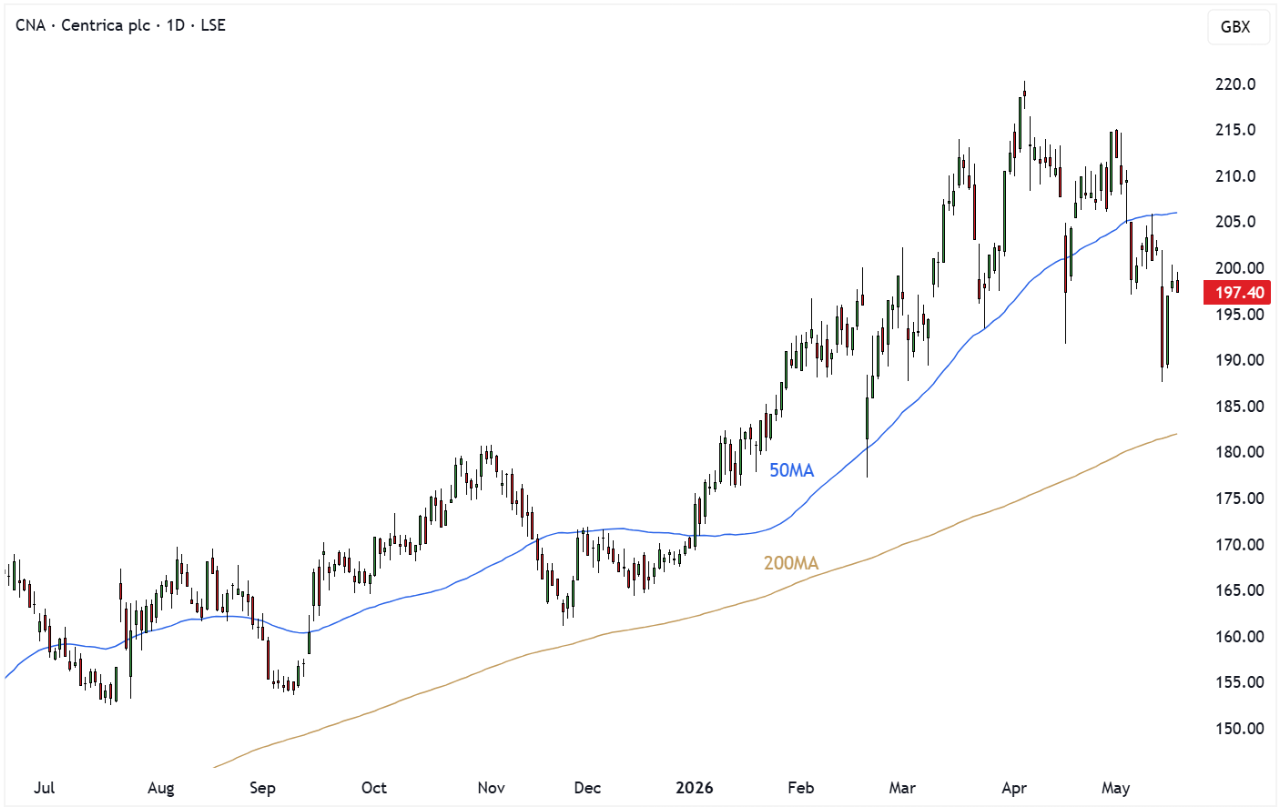
Centrica Still Paying for Past Mistakes
Centrica (CNA) found itself back in the headlines after British Gas agreed to pay £20m into a redress fund and write off up to £70m of customer debt following the prepayment meter investigation.
The issue relates to vulnerable customers who had prepayment meters installed without consent between 2018 and 2023. While management moved quickly to apologise and highlighted that the practice had already been halted several years ago, the episode serves as another reminder that reputational issues within regulated sectors can continue to reappear long after the original events.

From a financial perspective, the market reaction remained relatively contained. Centrica’s scale means the costs are manageable, and investors appear to view this more as a clean up exercise than a fresh operational problem. However, for a company that has spent years rebuilding credibility and simplifying its story, it is not the type of headline management would have wanted.
What we are watching next: customer trends and broader regulatory developments
Themes: Regulation | Utilities | Customer Redress
CNA Daily Candle Chart
Currys Continues Its Comeback Story
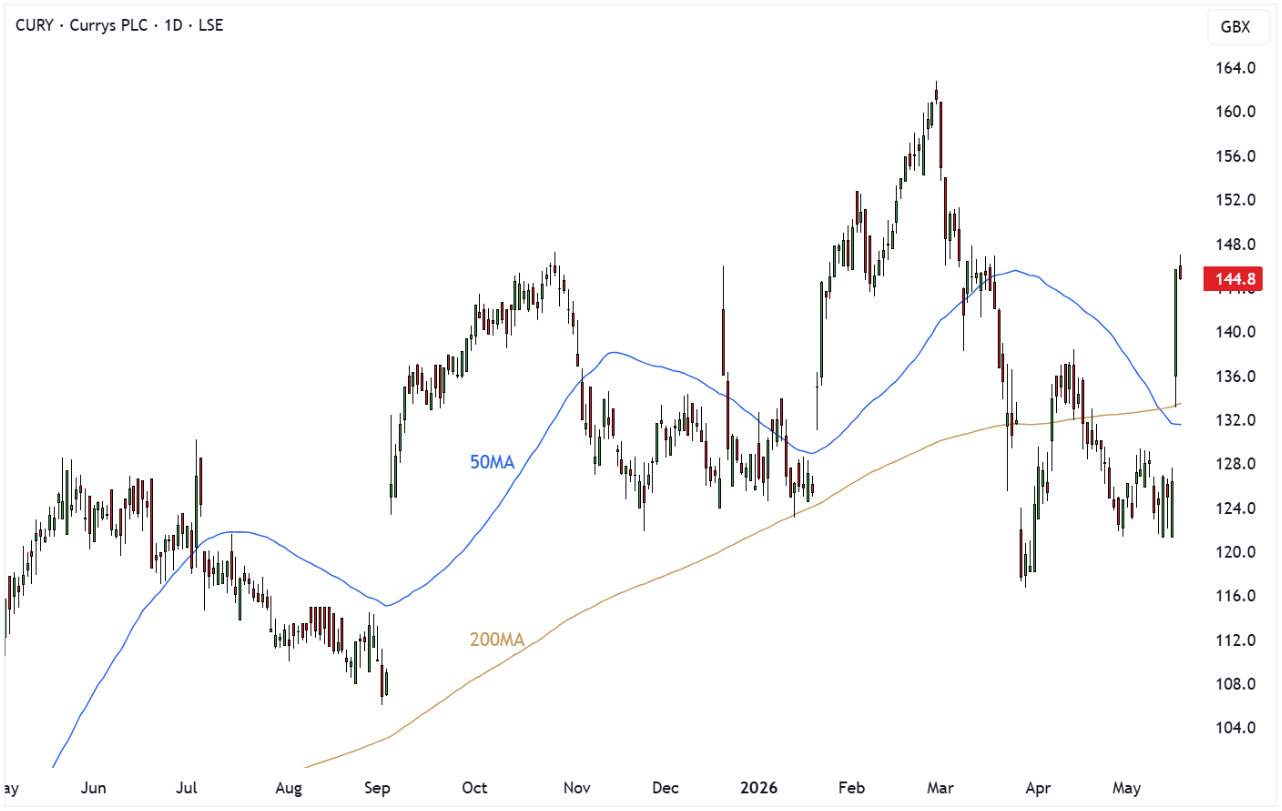
Currys (CURY) delivered another strong trading update, with profits coming in ahead of previous guidance as operational momentum continued to build across both the UK and Nordics businesses.
Full year adjusted profit before tax is expected to come in around £191m, ahead of earlier guidance of £180m to £190m and representing growth of approximately 18% year on year. Like for like sales increased 4% across the group while iD Mobile subscribers climbed 18% to 2.6 million. Services and B2B categories also continued to perform strongly.
There was a period where Currys looked like one of those retailers permanently trapped in turnaround mode. That increasingly feels like old thinking. Management continues to take market share, cash generation remains healthy and the business finished the year with more than £170m of net cash after returning £74m to shareholders. The market is increasingly recognising that this is becoming a structurally stronger business rather than simply benefiting from a short term consumer recovery.
What we are watching next: services growth and continued market share gains
Themes: Trading Update | Consumer | Capital Returns | Retail
CURY Daily Candle Chart
Diploma Keeps Compounding
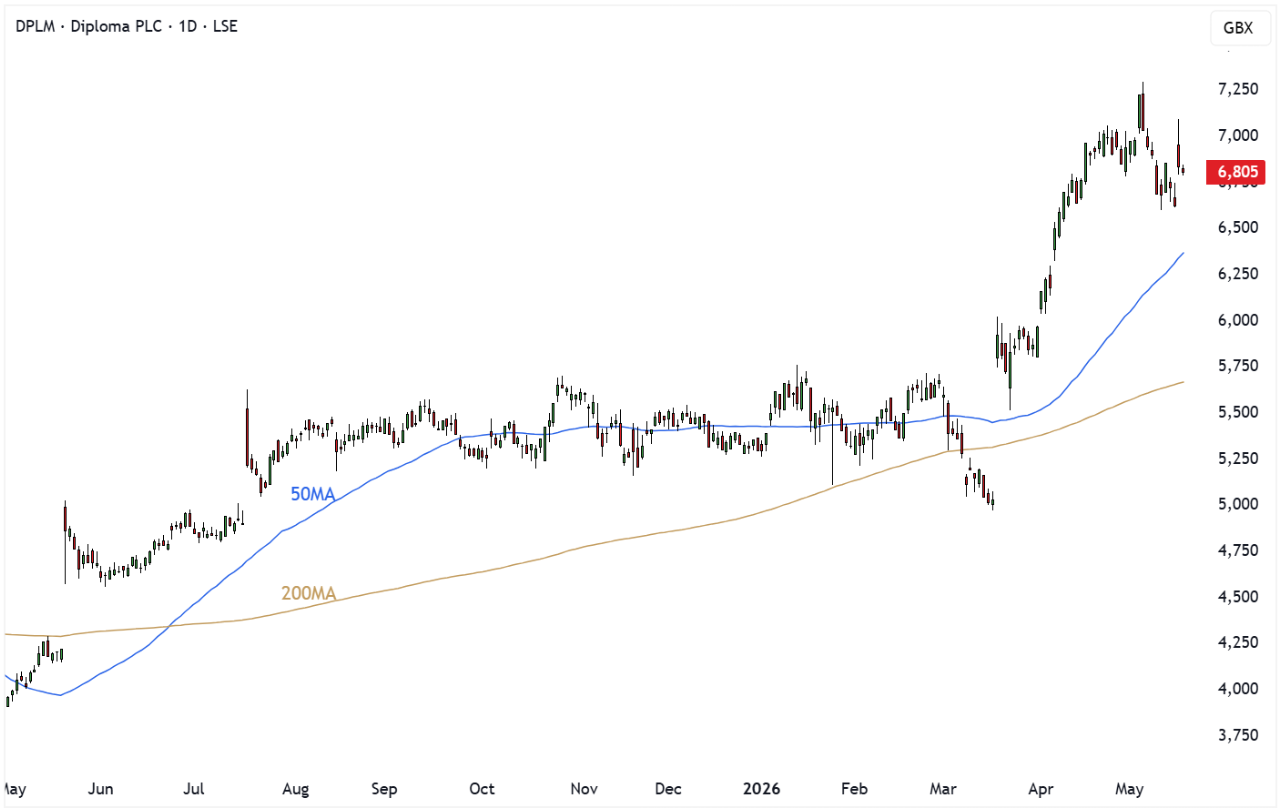
Diploma (DPLM) once again demonstrated why high quality compounders rarely stay cheap for long. The company delivered a very strong first half alongside another guidance upgrade.
Revenue increased 17%, with organic growth reaching an impressive 15%. Adjusted operating profit jumped 33% while margins expanded by 300 basis points to 24.5%. Free cash generation remained strong and management has continued to deploy capital aggressively into acquisitions, completing 15 deals over the last twelve months.
What continues to stand out here is consistency. Diploma is not reliant on a single product or market trend. Instead it continues to quietly execute across structurally growing areas including defence, aerospace, datacentres and life sciences. The phrase “quality compounder” gets thrown around frequently in markets, but Diploma increasingly looks like one of the cleaner examples of the model working exactly as intended.
What we are watching next: acquisition integration and margin sustainability
Themes: Half Year Results | Acquisitions | Industrial Growth
DPLM Daily Candle Chart
IG Group Steps on the Accelerator
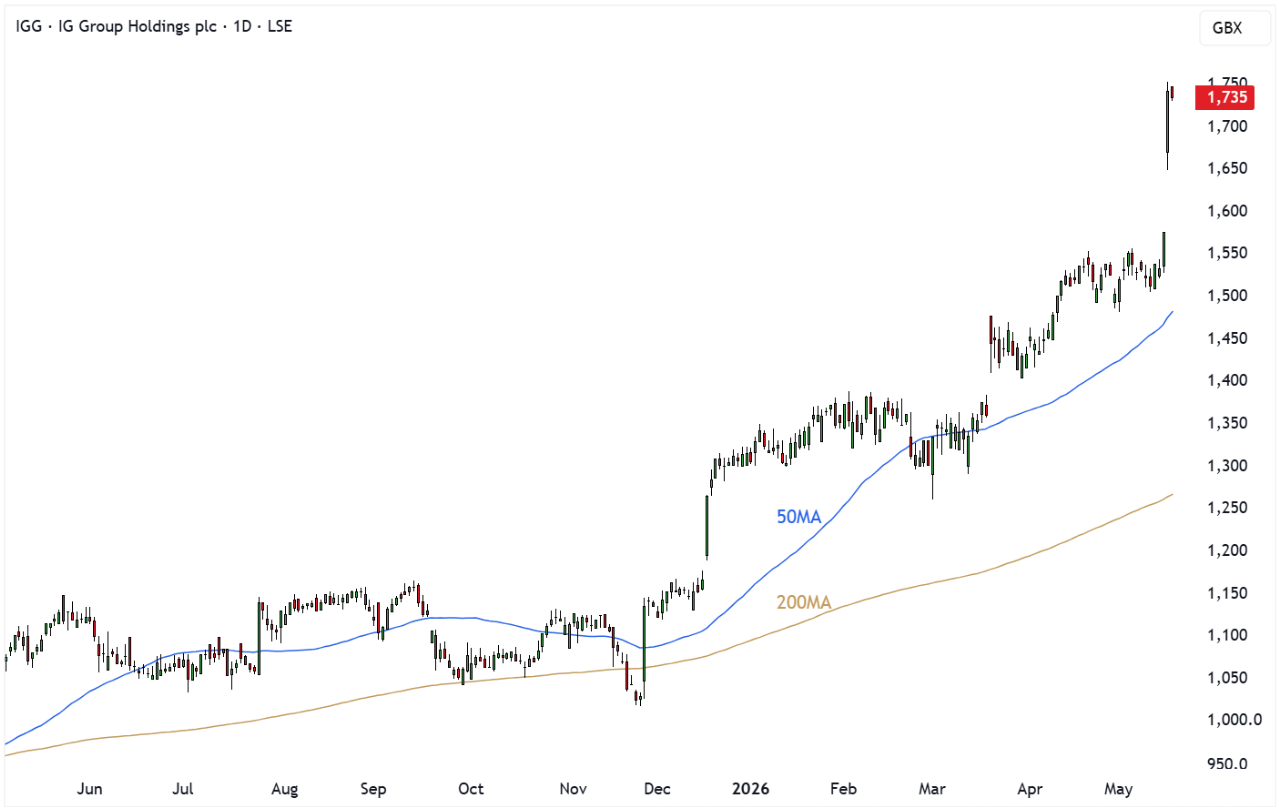
IG Group (IGG) delivered one of the strongest updates of the week, upgrading both near term guidance and its medium term outlook following a particularly strong start to the year.
Organic revenue rose 19% in the first quarter to £331m, while active customer growth accelerated for a fifth consecutive quarter. First trades surged 63% as stronger marketing execution and broader product offerings continued to attract customers. Assets under administration also moved above £20bn during April.
What feels different here is that growth increasingly appears driven by structural improvements rather than simply market volatility. The expansion into stock trading, crypto and multi product offerings appears to be gaining traction while customer engagement metrics continue improving. Investors historically worried that IG’s earnings were too reliant on unpredictable market conditions. Management increasingly seems to be building a broader financial platform rather than a pure trading business.
What we are watching next: customer growth and execution of new product launches
Themes: AGM Update | Trading Platform | Growth Upgrade | Crypto
IGG Daily Candle Chart
3i Group: Strong Numbers, Softer Questions
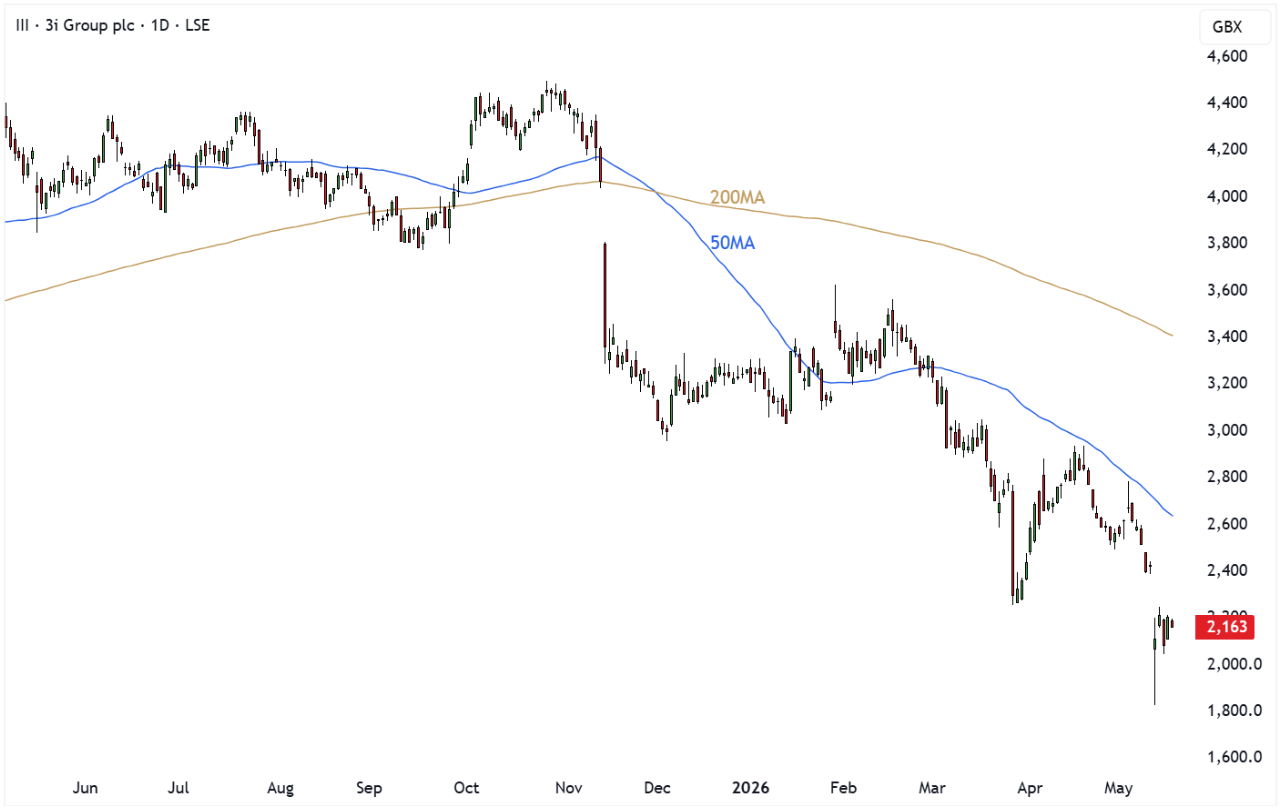
3i (III) delivered another set of impressive headline results, with total returns reaching £5.3bn and NAV per share climbing to 3,030p. Action continued to do much of the heavy lifting once again, while management also announced a substantial £750m share buyback programme.
The problem was not the historical numbers. The issue was what investors saw beneath them. Action’s year to date like for like sales growth slowed to 2.4% versus 6.8% in the comparable period last year, with weaker consumer activity in France and Germany creating some concerns. Seasonal categories also struggled following cooler weather conditions.
When a stock becomes heavily associated with one exceptional growth engine, investors tend to become sensitive to any sign that engine may be easing off slightly. Action remains a fantastic business and continues opening stores aggressively across Europe, but the market appears to be asking whether future growth can maintain the same pace that investors have become used to. Sometimes even strong results can disappoint when expectations become even stronger.
What we are watching next: Action like for like trends and consumer demand across Europe
Themes: Full Year Results | Buyback | Consumer | Private Equity
III Daily Candle Chart
Disclaimer:
All content is provided for general information only and should not be construed as any form of advice or personal recommendation. The provision of this content is not regulated by the Financial Conduct Authority.