20th Apr 2022. 8.59am

Regency View:
BUY Unilever (ULVR)
- Value
- Income
Regency View:
BUY Unilever (ULVR)
Unilever’s proven brand power should not be ignored
3.4bn people use a Unilever (ULVR) product every day!
From Dove to Ben & Jerry’s, Hellman’s to Walls, Unilever’s collection of brands make even Warren Buffett sit up and take note.
Indeed, the US investment mogul famed for investing in companies with ‘economic moats’ made a failed bid to buy Unilever in 2017 for $143bn.
Today, with Unilever’s market cap some 27% lower than Buffett’s buy price, we highlight why this global consumer goods powerhouse is should not be ignored.
Market is underestimating Unilever’s pricing power
Unilever’s brands are ‘premium’ consumer staples, leading many analysts to assume that sales will suffer as elevated inflationary pressure forces the end consumer towards own brand products.
This may be true in theory, but we’re yet to see it play out in practice…
Unilever has acted quickly pass inflationary costs onto consumers, but demand has proven sticky with performance in many of its key markets has been strong.
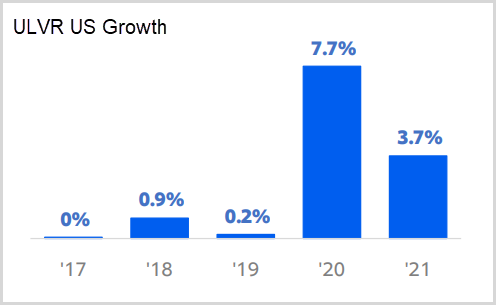
In the US, which is now Unilever’s largest market – generating more than €10bn of the group’s €52bn turnover last year, growth remains robust…
“We’ve really turned a corner on competitiveness in the US with over 65% of the business now winning market share” boasted CEO Alan Jope at an investor day in February.
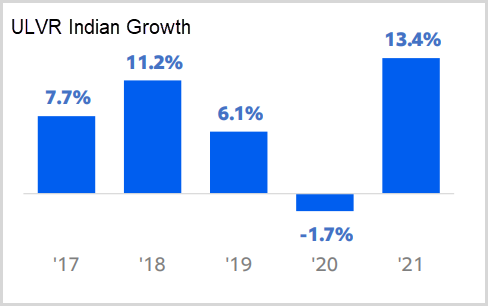
In India, Unilever’s biggest emerging markets business, with €5.6bn of group turnover, Unilever is capitalising on a market-leading position with growth in 2021 of 13.1%.
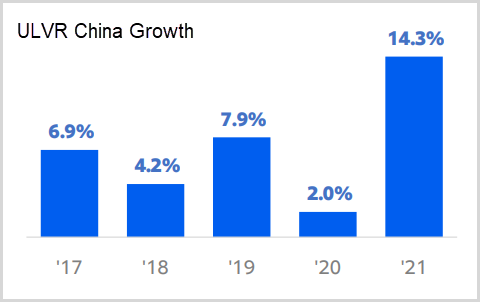
And in China, which is now Unilever’s third largest market, contributing €3.3bn (FY21), growth accelerated 14.3% last year despite severe Covid-19 lockdowns in some parts of the country.
It seems that Unilever has also managed to cope with the inflation-lead margin squeeze by undergoing a group restructuring that has created more than €600m in cost savings.
And whilst margins are set to squeeze this year, due to higher input costs, Unilever expect margins to bounce back quickly in 2023 as inflationary pressures ease.
Bullish ‘fakeout’ forms at long-term lows
There’s no denying Unilever’s share price has performed poorly during the last six months…
The shares have been dragged all the way back to their post-pandemic lows of 3,308p – reached in March 2020.
Given the V-Shaped recovery which occurred the last time Unilever reached these prices, we’ve been paying closed attention to the shares recent price action…
A brief dip below the March lows occurred last month, but this quickly attracted buyers – taking prices back above support to form a bullish ‘fakeout’ reversal pattern.
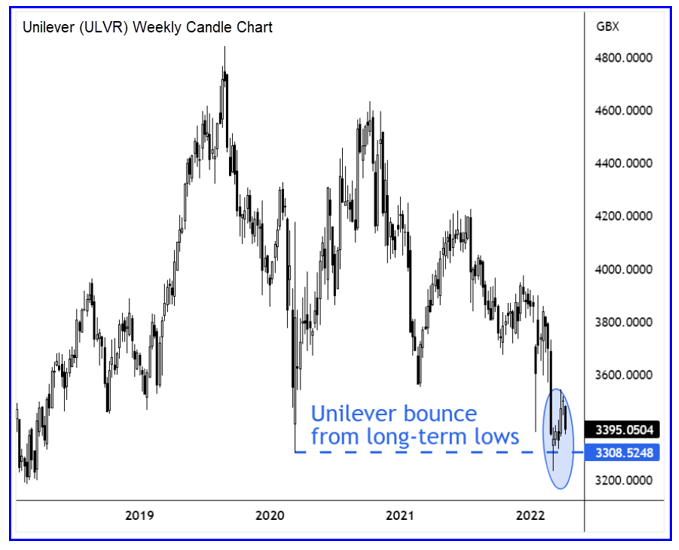
Whilst short-term momentum remains firmly in favour of the bears, from a longer-term investment perspective, the shares now offer attractive levels of risk / reward.
Cash is king
Alongside Unilever’s opportune technical timing, the shares also offer at attractive levels of income…
The shares trade on a forward dividend yield of 4.21% – one of the best in the Personal & Household Products & Services sector.
And whilst this dividend isn’t among the FTSE’s top payers, Unilever has that recession-resistant stability which comes at a premium…
Cashflow is very strong and consistent, operating cashflow has remained stable around the £300m mark for the last four years, and over 80% of operating cashflow is converted into free cashflow.
Unilever’s dividend is covered 1.3 x earnings (FY21) and the company has a strong track record in maintaining its payout (6.2% CAGR 5-year average dividend growth).
Alongside a 4% increase in their FY21 dividend, Unilever also announced a £3bn share buyback which should be supportive for the shares during the remainder of this year.
Overall, we believe snapping up Unilever at current levels looks a sensible long-term move that should see investors rewarded as inflationary pressures ease next year.
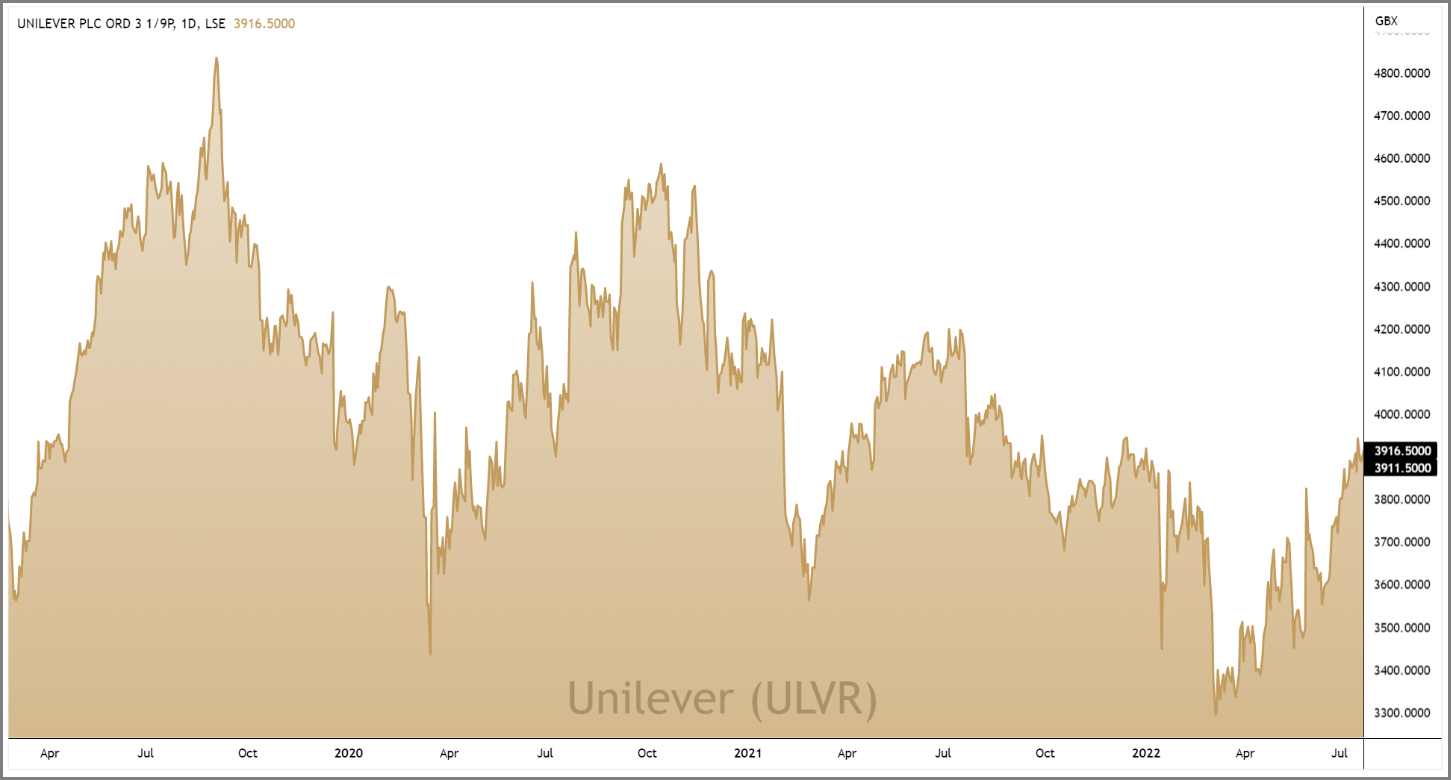
ULVR 3-Year Chart
Disclaimer:
All content is provided for general information only and should not be construed as any form of advice or personal recommendation. The provision of this content is not regulated by the Financial Conduct Authority.