1st May 2024. 9.01am
Regency View:
BUY Saga (SAGA)
- Value

Regency View:
BUY Saga (SAGA)
Insurance stalwart Saga looks good value
At the heart of value investing lies the quest for the overlooked and underappreciated – a pursuit that often leads investors to hidden gems like Saga (SAGA).
Founded on the principle of catering to the unique needs of individuals over 50 in the UK, Saga has solidified its position as a stalwart in the market. With a best-in-breed brand known for quality customer service, and a diverse portfolio spanning package holidays, insurance, and personal finance, Saga embodies the essence of value waiting to be unlocked.
Brand loyalty
Saga’s robust brand reputation serves as a cornerstone of its success. Known for its unwavering commitment to customer satisfaction, Saga has cultivated a loyal customer base over the years. This brand loyalty not only enhances customer retention but also provides a solid foundation for future growth and profitability.
The company’s diverse portfolio further bolsters its financial stability. While its insurance arm remains a core focus, Saga’s foray into package holidays and personal finance adds layers of resilience to its business model. This diversified revenue stream mitigates risks associated with fluctuations in any single market segment, providing investors with a sense of security and confidence in Saga’s long-term prospects.
Cruising division drives doubling in profit
Saga’s recent trading update paints a picture of robust growth, with the cruising division emerging as a significant driver behind the company’s solid performance. The company’s underlying profit soared, doubling from £15.5 million to an impressive £38.2 million. This surge can be largely attributed to the exceptional performance of Saga’s cruising division, which exceeded expectations and propelled the company’s top line.
The Ocean Cruise segment reported a remarkable turnaround, with underlying profit before tax skyrocketing to £35.5 million, a substantial improvement from just £0.7 million in the previous year. This growth underscores the strong demand for Saga’s cruising services and the effectiveness of its operational strategies in capturing market opportunities in this sector.
Furthermore, the cruising division’s stellar performance contributed significantly to Saga’s overall trading earnings (EBITDA), which surged by 26% to reach £116.5 million, up from £92.5 million in the prior year. Despite challenges faced by its Insurance business, Saga’s proactive approach to repositioning the segment for success, coupled with the outstanding performance of its cruising division, bodes well for the company’s future growth prospects.

Financial resilience: Saga’s falling debt and rising cashflow
Saga has achieved a significant reduction in net debt, with figures dropping by £74.5 million over the past 12 months, from £711.7 million to £637.2 million. This reduction reflects Saga’s prudent financial management and strategic initiatives aimed at improving its balance sheet.
Additionally, Saga’s available operating cash flow jumped by 162% to reach £143.8 million, compared to £54.9 million in the previous year. This substantial growth in cash flow not only enhances Saga’s liquidity but also provides the company with greater flexibility to invest in growth opportunities and navigate potential challenges.
The combination of falling debt levels and rising cash flow positions Saga to weather economic downturns and capitalise on market opportunities. With a strengthened financial foundation, our attention turns to Saga’s valuation…
Undervaluation in comparison
When compared to its industry peers and broader market benchmarks, Saga’s valuation metrics paint a compelling picture of undervaluation.
Saga’s forward PE ratio stands at a remarkably low 3.4, reflecting a substantial discount compared to both its industry peers and the broader market. This suggests that investors may not fully appreciate Saga’s earnings potential and growth prospects, leading to an undervaluation of its shares.
Additionally, Saga’s Price to Book (P/B) ratio further underscores its undervaluation relative to its asset base. With a P/B ratio of just 0.69, Saga’s shares are trading at a significant discount to its book value, indicating that the market is not fully recognising the value of its tangible assets and equity.
Furthermore, when considering Saga’s Price to Sales (P/S) ratio, which measures a company’s market capitalization relative to its total sales, we see a similar pattern of undervaluation. Saga’s P/S ratio is notably lower than that of its industry peers, suggesting that investors may be overlooking the company’s revenue generation potential.
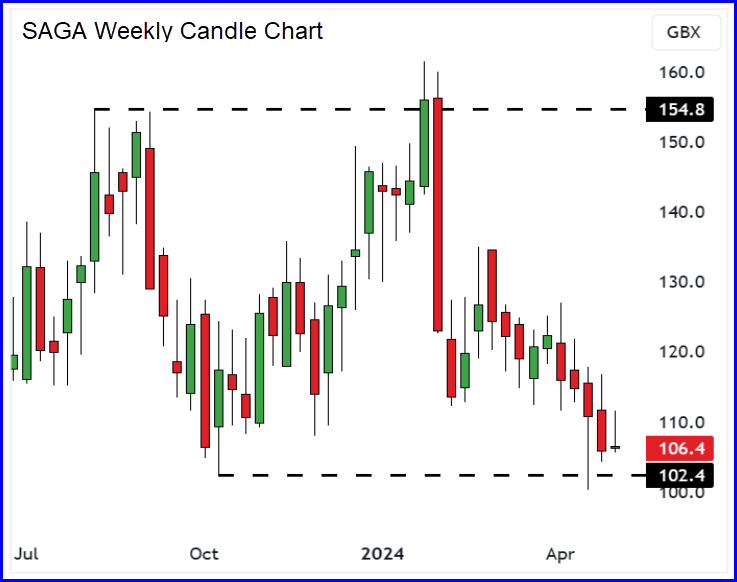
With UK stocks at all-time highs and Saga’s share price languishing near long-term support, there’s no escaping Saga’s underperformance. However, with improving financials and a rock-solid brand, we believe Saga is too cheap to ignore. And should the market start to recognise its value, a return back to the top of its recent trading range would indicate a short-term upside of more than 40%.
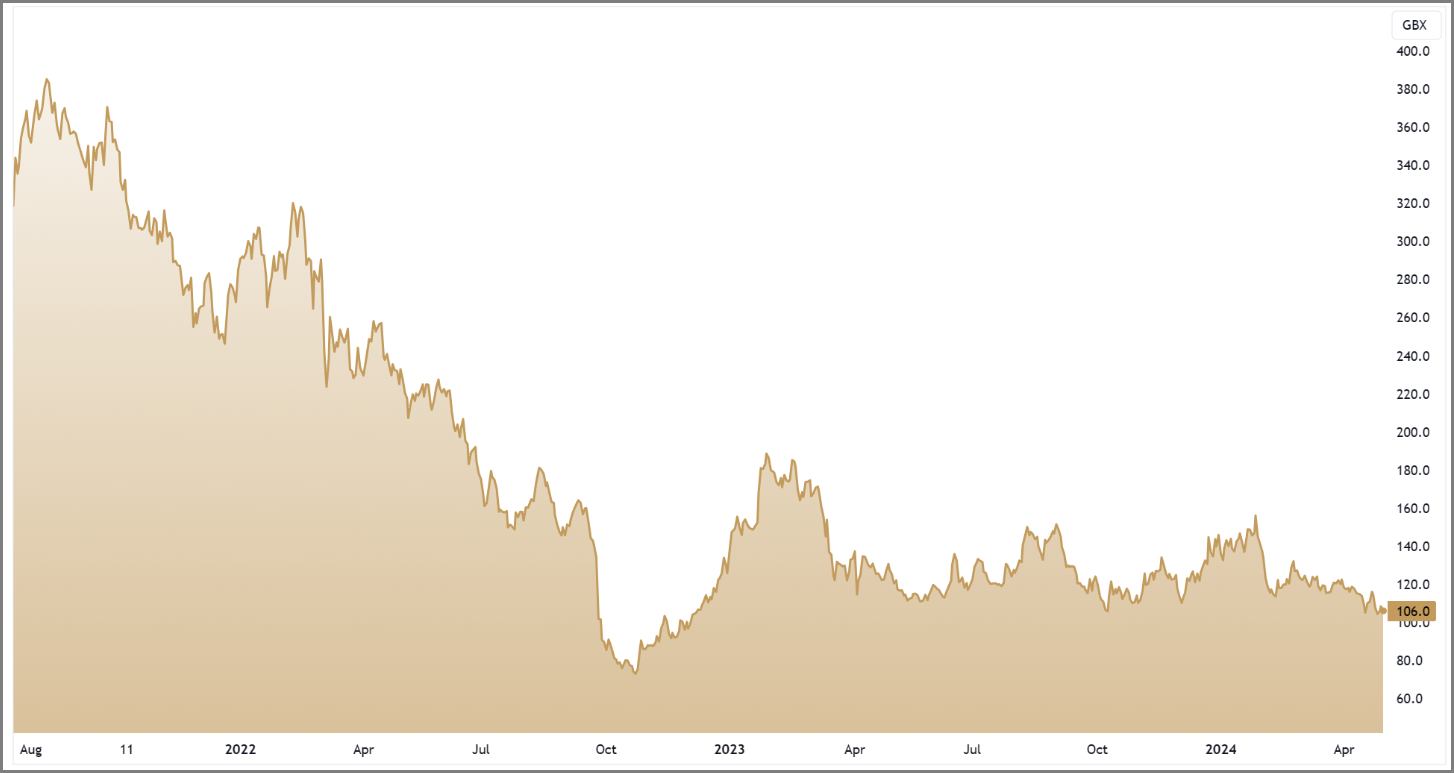
SAGA 3-Year Chart
Disclaimer:
All content is provided for general information only and should not be construed as any form of advice or personal recommendation. The provision of this content is not regulated by the Financial Conduct Authority.