24th Aug 2022. 8.58am

Regency View:
BUY HSBC (HSBA)
- Value
- Income
Regency View:
BUY HSBC (HSBA)
HSBC’s ‘Pivot to Asia’ delivering profits
For years, HSBC (HSBA) was seen as a bank that didn’t play to its strengths…
HSBC allocated its capital in broadly equal proportions across Asia, the America’s, and EMEA regions, but more than 80% of profits were generated from Asia.
The penny finally dropped during the pandemic, and HSBC unveiled its ‘Pivot to Asia’ strategy in which it planned to trim $4.5bn in costs, cut 35,000 jobs and shift $100bn in risk-weighted assets to Asia.
And with a nudge from Chinese insurer, Ping An, its largest shareholder, HSBC is finally playing to its strengths and delivering decent returns.
The shares trade on a single-digit earnings multiple with double-digit earnings per share (EPS) growth. And with quarterly dividends reinstated to placate Ping An’s break up calls, we believe the shares offer attractive levels of value and income.
Strong Half-Year Results
Earlier this month, HSBC delivered a market-beating set of Half-Year numbers…
Reported profit before tax was $5.1bn, well ahead of market estimates of $3.98bn, and EPS jumped 65% year-on-year to $0.28, double the consensus estimate of $0.14.
At the divisional level, Wealth and Personal Banking’s Q2 adjusted revenue was up 5% year-on-year, Commercial Banking adjusted revenue increased 19% during the same period, and Global Banking & Markets’ saw a similar double-digit jump in Q2 adjusted revenue (15% year-on-year).
CEO Noel Quinn sited “strong revenue momentum, tight cost control and normalising interest rates” as key factors behind the impressive numbers.
Indeed, HSBC’s cost savings helped underlying operating expenses fall 1% and Mr Quinn said: “we remain confident in our ability to deliver 2022 adjusted operating expenses in line with 2021, despite inflationary pressures.”
The only negative in the numbers was a 2.2% decline in the bank’s CET1 ratio (core equity tier 1) to 13.6%, below management’s 14% to 15% target range. However, HSBC expect its CET1 ratio to move back within its target range during the first half of 2023, and a glance at HSBC’s rock-solid balance which has high levels of surplus deposits shows that financial security isn’t an issue.
Exposure to the troubled Chinese commercial real estate sector, as well as exposure to Russian counterparties is an ongoing concern, but HSBC have put aside over $1bn against potential defaults – less than the market had previously feared.
And on revenue outlook, HSBC remain very positive:
“Based on the current market consensus for global central bank rates and our continued mid-single-digit percentage lending growth expectations for 2022, we would expect net interest income of at least $31bn for 2022 and at least $37bn for 2023 (based on average June rates of foreign exchange).”
Value & Income
HSBC’s forward valuation looks attractive, especially in the context of their improved outlook…
Investors are being asked to pay just over 7 times HSBC’s future earnings, which is very reasonable given forecast EPS growth of 15%.
And a price to tangible book value of 0.87 puts HBSC firmly in the top quartile of value stocks in the market.
This valuation looks attractive relative to HSBC’s Return on Tangible Equity forecast for 2023 which was recently raised to 12% from 10%-plus previously.
This stock will also be back among the FTSE’s top dividend payers next year when HSBC reinstates its quarterly dividend with pay-out ratio of 55% of net income, compared with 40% now.
Bullish Ascending Wedge
HSBC’s share price has formed a strong recovery uptrend during the last two years – carving out a series of higher swing lows and higher swing highs on the weekly candle chart (right).
And after a pullback in-line with the wider market during Q1 2022, HSBC’s share price has been in ‘consolidation mode’.
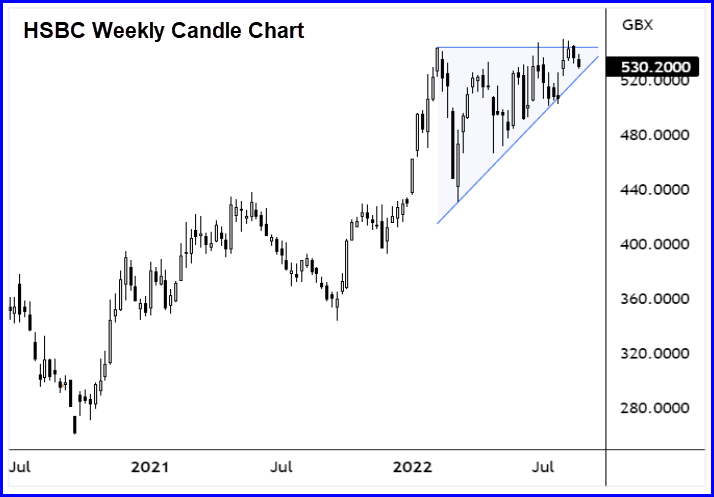
This consolidation phase has taken the form of a bullish ascending triangle pattern – a pattern which indicates that the shares are being ‘accumulated’ prior to a breakout higher in-line with the dominant trend.
Prices are being ‘funnelled’ towards the apex of the triangle, and after a bullish reaction to HSBC’s Half-Year results, we’ve seen prices coil just beneath resistance at 543p.
We’re looking to position ourselves within the bullish ascending triangle pattern in order to maximise our ability to capture a breakout should it occur.
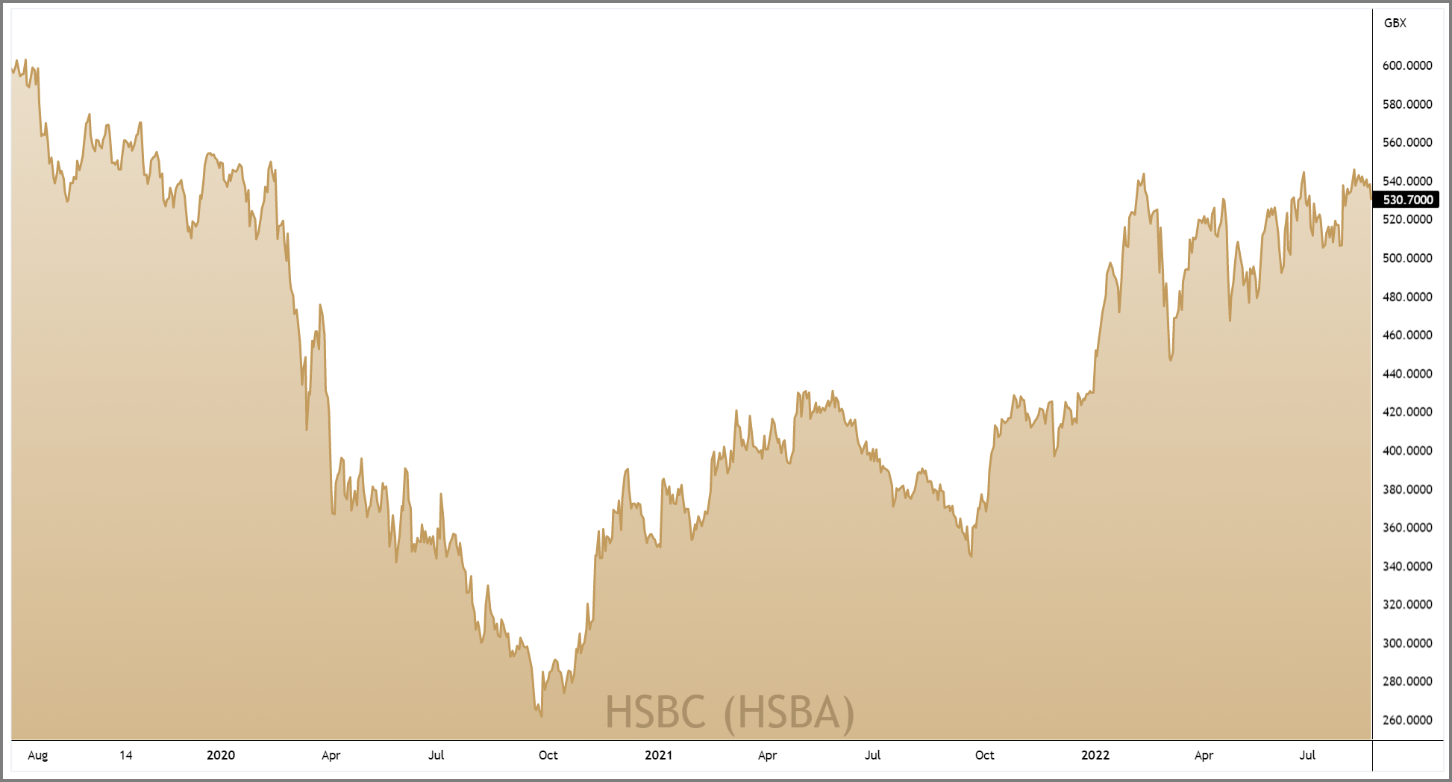
HSBC 3-Year Chart
Disclaimer:
All content is provided for general information only and should not be construed as any form of advice or personal recommendation. The provision of this content is not regulated by the Financial Conduct Authority.