8th Jun 2023. 8.57am

Regency View:
Update
Regency View:
Update
Alliance Pharma sees sales surge, but currency and rates impact profit outlook
Alliance Pharma (APH) provided a short trading update to accompany their recent AGM.
The consumer healthcare group said sales for the first four months of this year are doing better than the same period last year.
Things are looking up for Alliance’s stretch mark cream, Kelo-Cote. Sales in China are recovering nicely, as predicted in a previous announcement during March.
Although Alliance said it was on track to meet revenue and adjusted earnings targets for the year, a stronger UK pound against the US dollar and rising interest rates are putting a slight dampener on its adjusted profit before tax expectations.
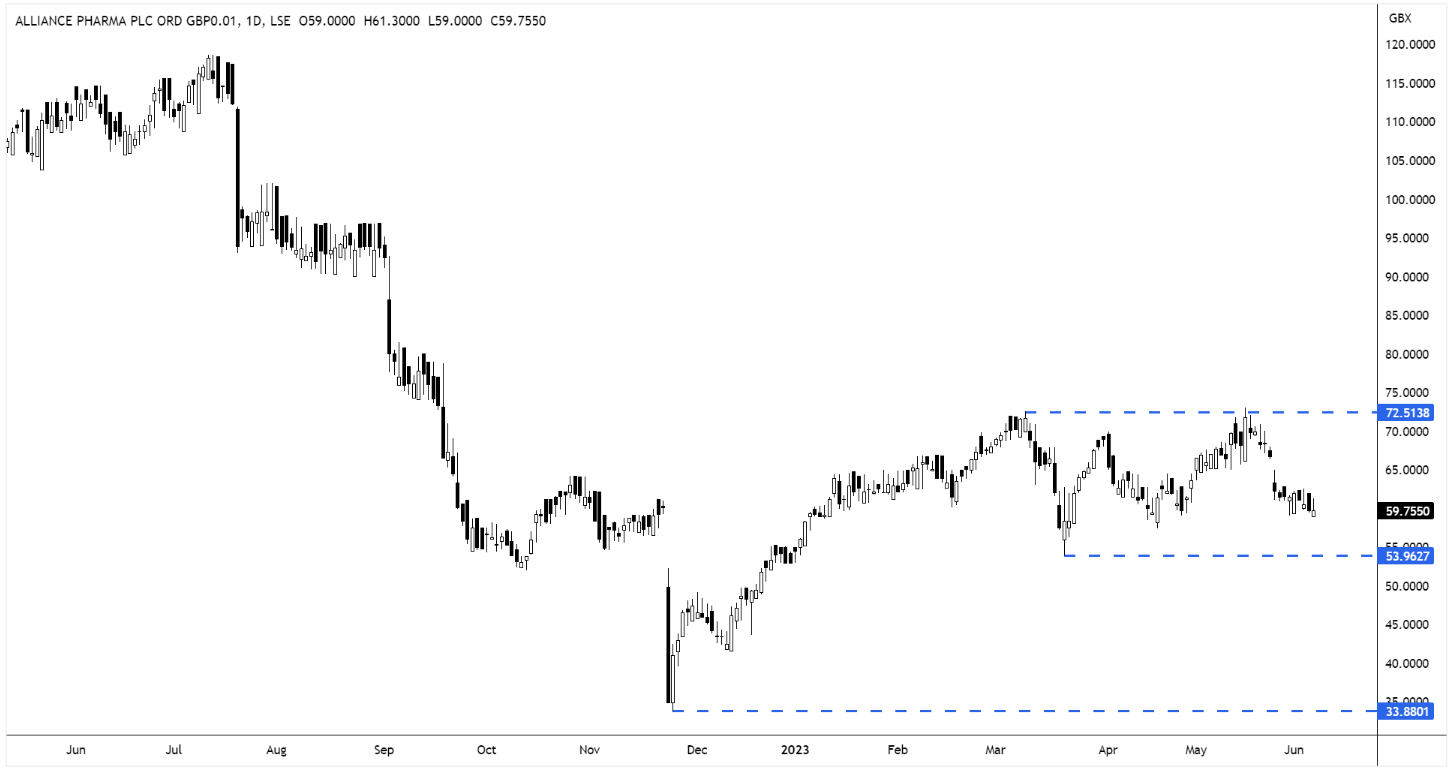
On the price chart, Alliance failed to break through resistance at 72p last month and have since started to retreat.
APH Daily Candle Chart
Oxford Metrics reports strongest half-year performance, eyes growth opportunities
Oxford Metrics (OMG) said it has achieved its strongest-ever half-year trading performance, driven by high demand across all market segments and a robust order book.
The smart sensing software company delivered record revenue of £21.3m, up 70% compared to the previous year.
Oxford Metrics said it has focused on expanding its market opportunities and continues to invest in the current product offering, whilst also actively pursuing strategic acquisitions.

With a strong balance sheet, boasting a net cash position of £63.6m, and promising sales pipeline visibility, the company expects to exceed current market expectations and deliver a strong performance in FY23.
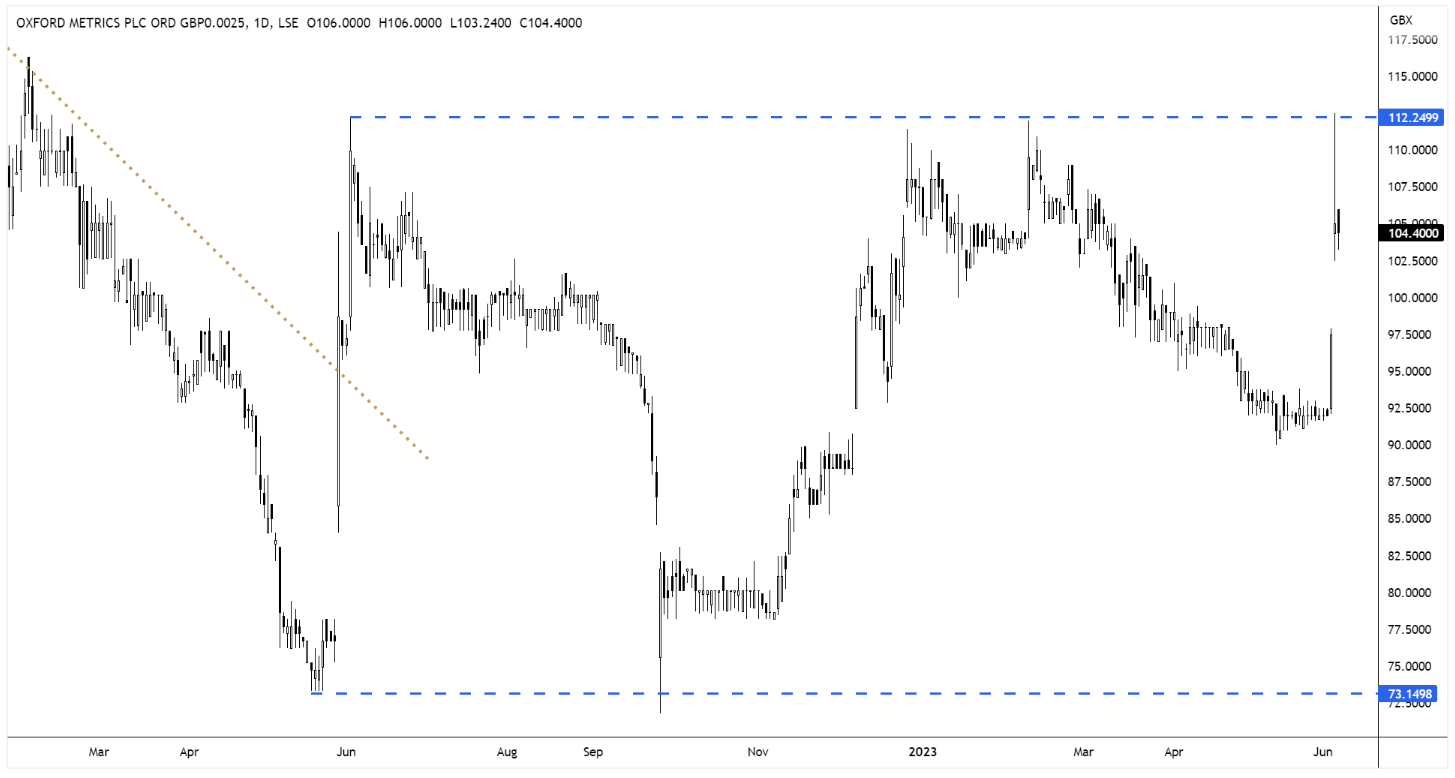
The market enjoyed the results and the shares gapped higher in response – taking prices back to an area of key short-term resistance.
We first recommended Oxford Metrics back in July 2020, but based on these results we would not rule out snapping up a second tranche. We’ll be watching to see how the shares deal with resistance.
OMG Daily Candle Chart
Pan African faces setback as production guidance falls
Shares in Pan African Resources (PAF) dropped last week after it lowered its production guidance for the current financial year ending on June 30, 2023.
Pan African revised its production guidance to approximately 175,000 ounces of gold, lower than previously expected, mainly due to challenges with electricity supply from Eskom and slower ramp-up at Barberton Mines and Evander Mines.
However, the tailings operations at Barberton and Elikhulu are performing as expected. Pan African expects a further production increase in the next financial year and the commencement of construction for the Mintails project.
Despite the lower production, the company expects a robust financial performance due to favorable gold prices and cost control measures.

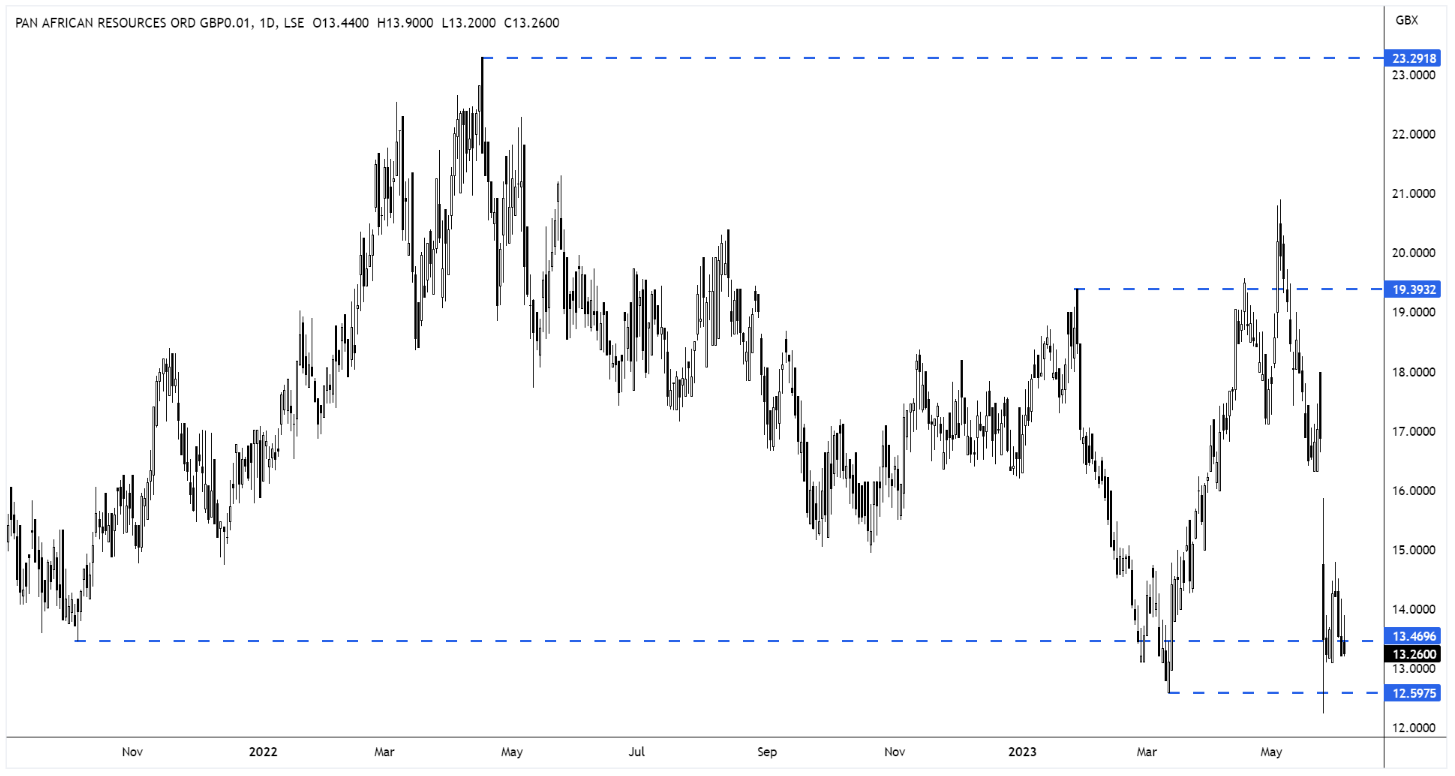
Pan African’s share price is now trading back at a key level of long-term support and we will be looking for this to hold firm in the coming months.
PAF Daily Candle Chart
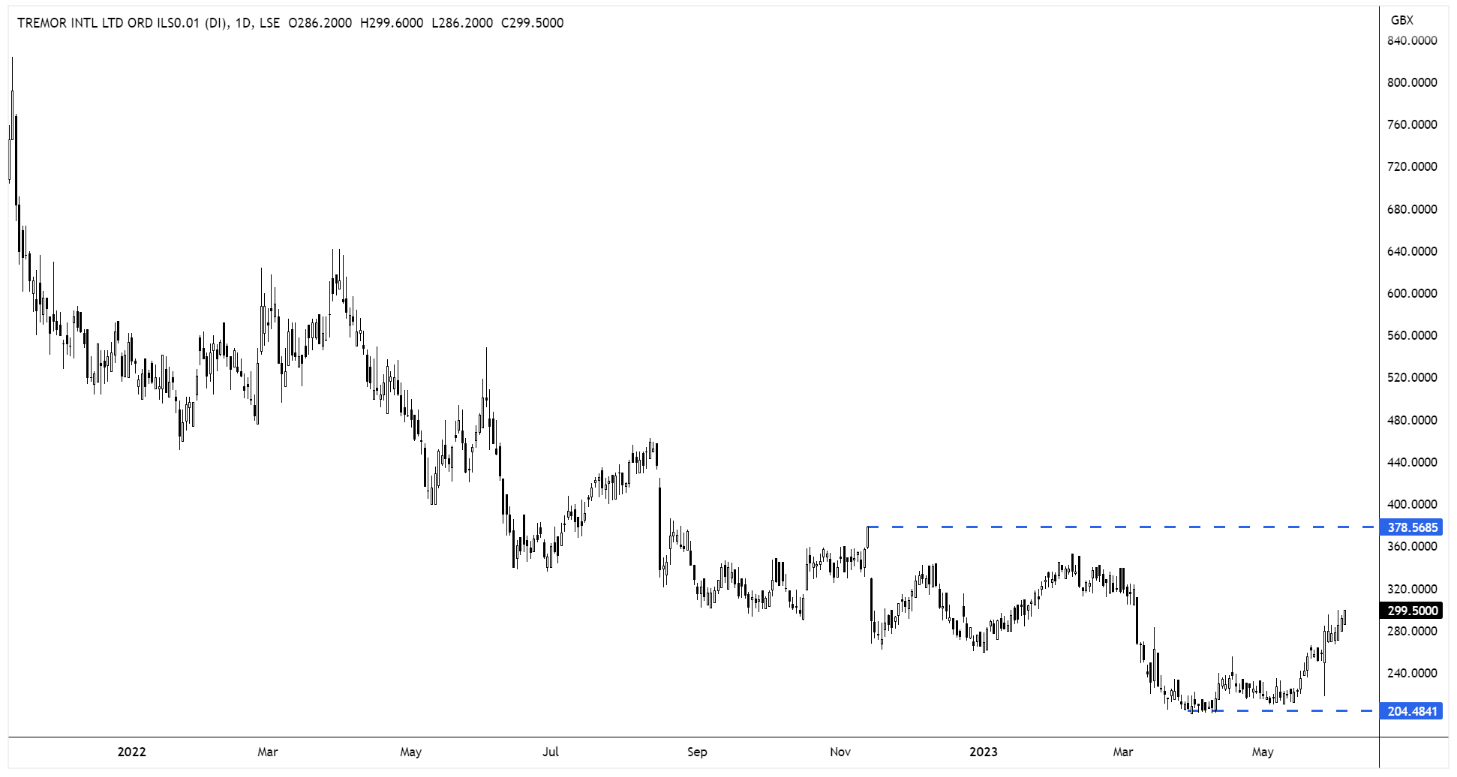
Tremor reports strong CTV growth in Q1, despite economic challenges
Tremor International (TRMR) have bounced following the release of their results for the first quarter ended March 31, 2023.
The Connected TV (CTV) advertiser said it achieved significant growth in its CTV footprint, with CTV revenue increasing by 34% year-over-year and accounting for 34% of programmatic revenue.
However, Tremor reported a decrease in Q1 2023 Contribution ex-TAC (a similar measure to gross profit) compared to the same period in 2022, primarily due to macroeconomic challenges impacting advertiser budgets.

Tremor recently launched a cross-platform planner, which is expected to expand its total addressable market and said that it expects revenue and profit growth in the second quarter of 2023, driven by improved advertising conditions.
Management have maintained their full-year guidance for Contribution ex-TAC and Adjusted EBITDA, expecting improved momentum in the second half of 2023.
Tremor CEO, Ofer Druker said:
“We are pleased to reiterate our full year 2023 Contribution ex-TAC and Adjusted EBITDA guidance and believe we are poised to capitalize on ongoing industry trends with enhanced scale to further our leadership position in programmatic CTV advertising.”
TRMR Daily Candle Chart
Disclaimer:
All content is provided for general information only and should not be construed as any form of advice or personal recommendation. The provision of this content is not regulated by the Financial Conduct Authority.