25th Feb 2021. 8.56am

Regency View:
Update
Regency View:
Update
AIM Investor Performance – please click to view
Pan African remains on track to hit full-year production target
Pan African Resources (PAF) posted a strong set of interim results for the six months to 31 Dec 2020.
The gold miner said production increased by 5.9% to 98,386oz and it remains on track to produce its guided 190,000oz of gold for the financial year ended June 21.
Group all-in sustaining costs (AISC) increased marginally to US$1,252/oz, including realised hedge losses of US$6.7 million, which if excluded reduces the Group’s AISC to US$1,182/oz.

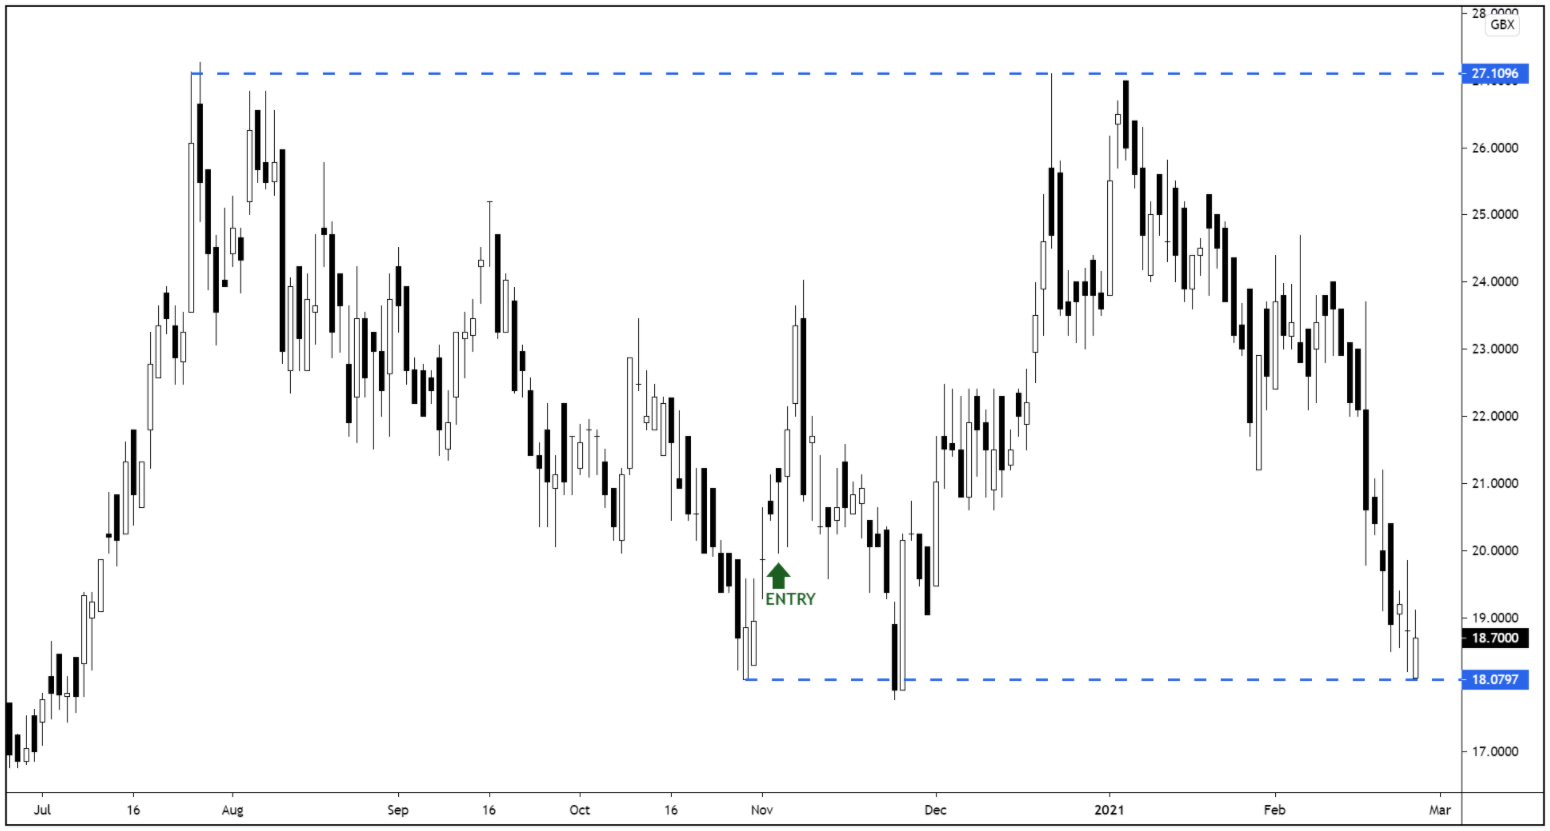
On the price chart, PAF have been dragged back to a level of long-term support at 18p – a move that is in-line with the underlying gold price.
We will be looking for buyers to step in and support the shares at this key structural level.
PAF Daily Candle Chart
Begbies bounce on Q3 update
Insolvency group Begbies Traynor (BEG) released a confident trading statement this week.
“The group has continued its strong trading performance since the half year across both of its operating divisions. This performance leaves us confident of the outcome for the full year and delivering results at least in line with expectations for the year as a whole” read the opening statement…
It went on to say that the business recovery and financial advisory sides of the business continue to perform well “maintaining its run rate for activity levels and new appointments” in spite of continued government support.
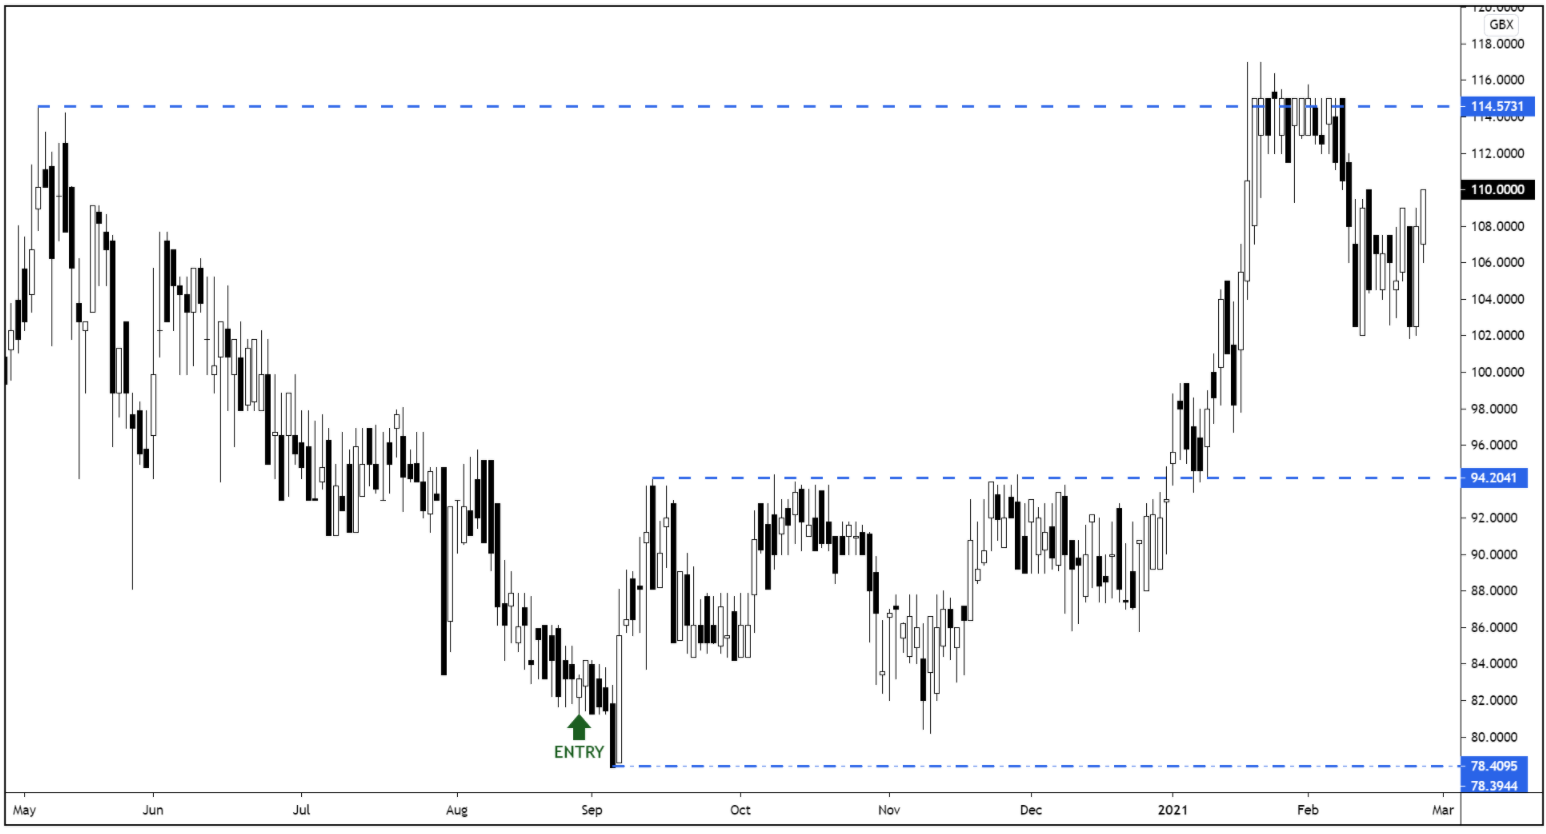
The shares failed to break above long-term resistance at 114p and have since undergone a small retracement. However, prices have started to stabilise and form a new higher swing low on the back of the positive trading update – indicating that another attempt to break the 114p barrier is on its way.
BEG Daily Candle Chart
Arcontech’s profit drops but outlook is positive
Fintech group Arcontech (ARC) released their interim results for the six months ended Dec 2020.
The headline numbers were a mixed bag with turnover increasing by 4.7% to £1.5m and profit falling 8% to £0.5m.
Net cash continued to remain healthy at £4.4m and full year profit is expect to be “in line with market expectations”.
Despite the mixed number, the Chairman’s statement had an upbeat tone with the group in a “good position to accelerate growth once market conditions improve”.

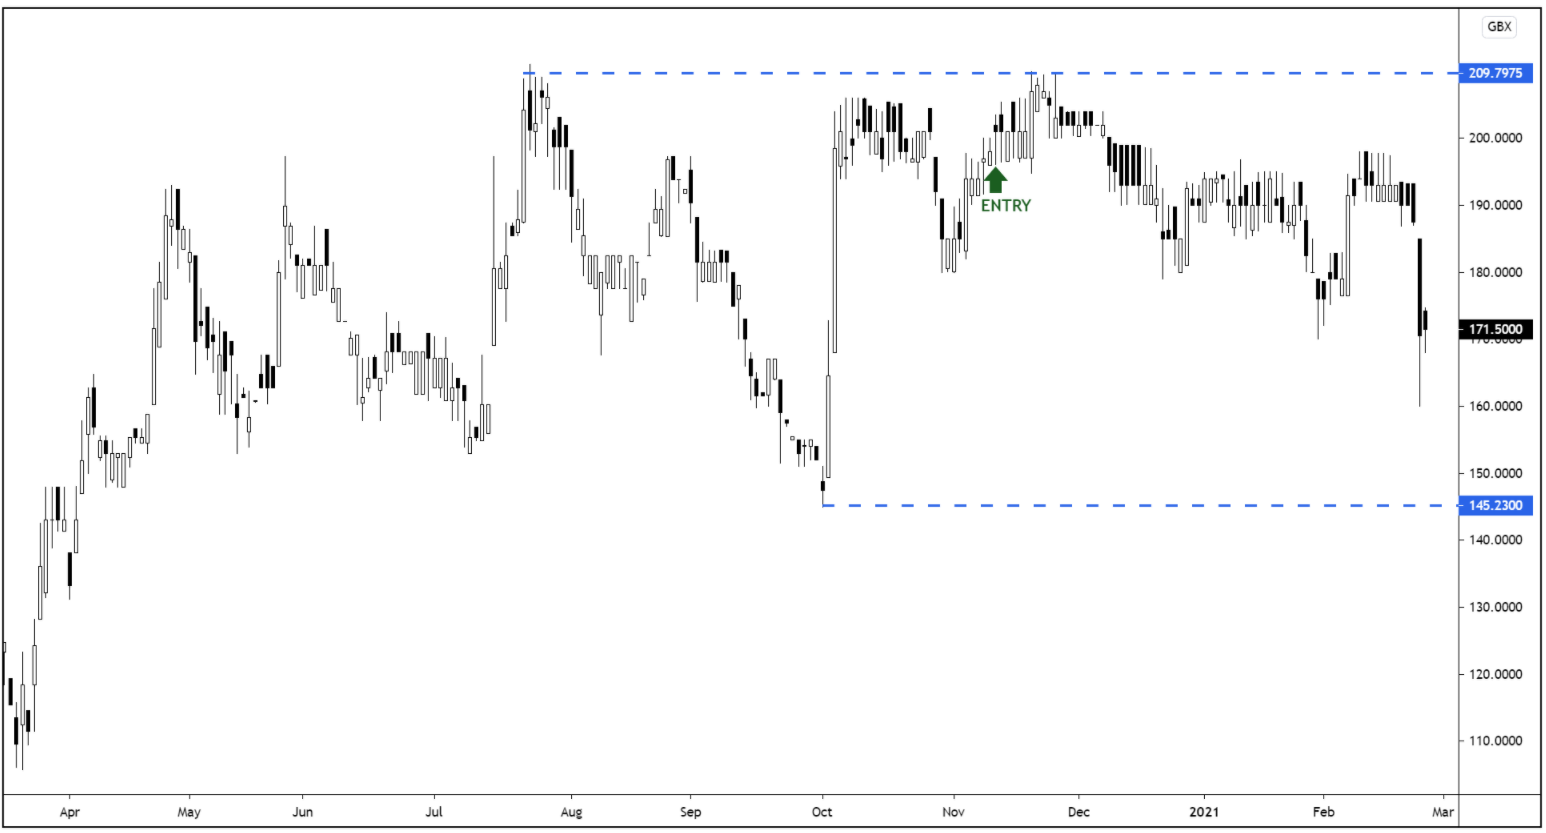
The market wasn’t inspired the numbers and the shares have dropped back towards support following the results.
Long-term support at 145p (October lows) remains a key barometer for our position and we will be watching closely to see how price action develops over the coming weeks.
ARC Daily Candle Chart
OMG release upbeat AGM statement
Oxford Metrics (OMG) released an AGM statement last week which indicated that trading was in-line with expectations.
“The Group is currently trading in-line with achieving market expectations for the full year ending September 2021” read the statement…
Their 3D motion capture arm Vicon has started the year well with strong trading in Asia Pacific. And OMG’s infrastructure software business, Yotta “continues to generate reliable and growing levels of recurring revenue as customers continue to prioritise digital transformation in public asset management to enable remote working”.

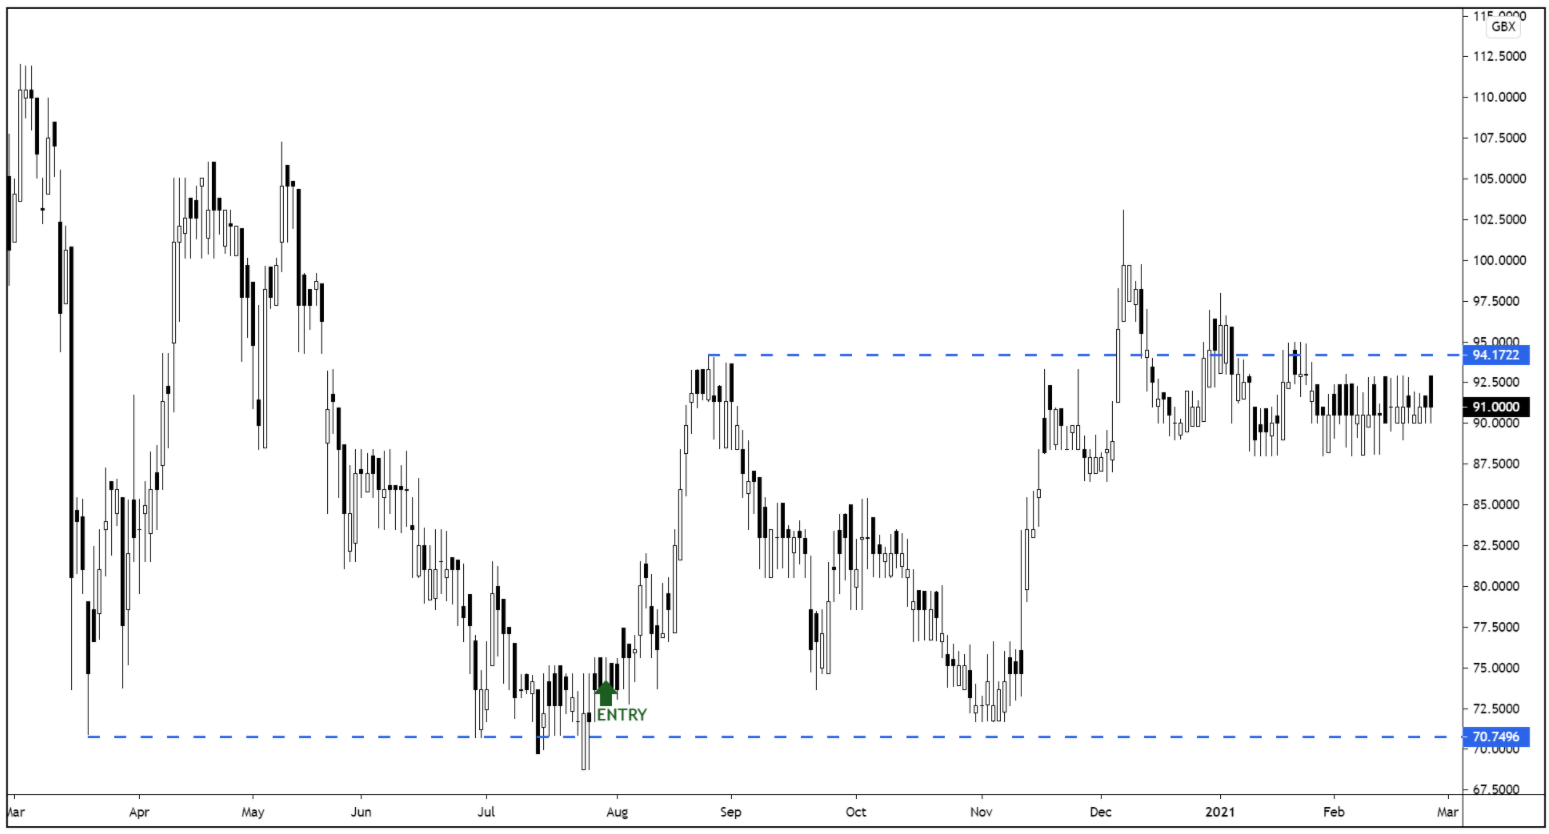
On the price chart, OMG continue to consolidate, just beneath key resistance at 94p. This high and tight consolidation is a bullish sign as it indicates that the shares are being accumulated.
OMG Daily Candle Chart
Learning Tech buy Bridge for $50m
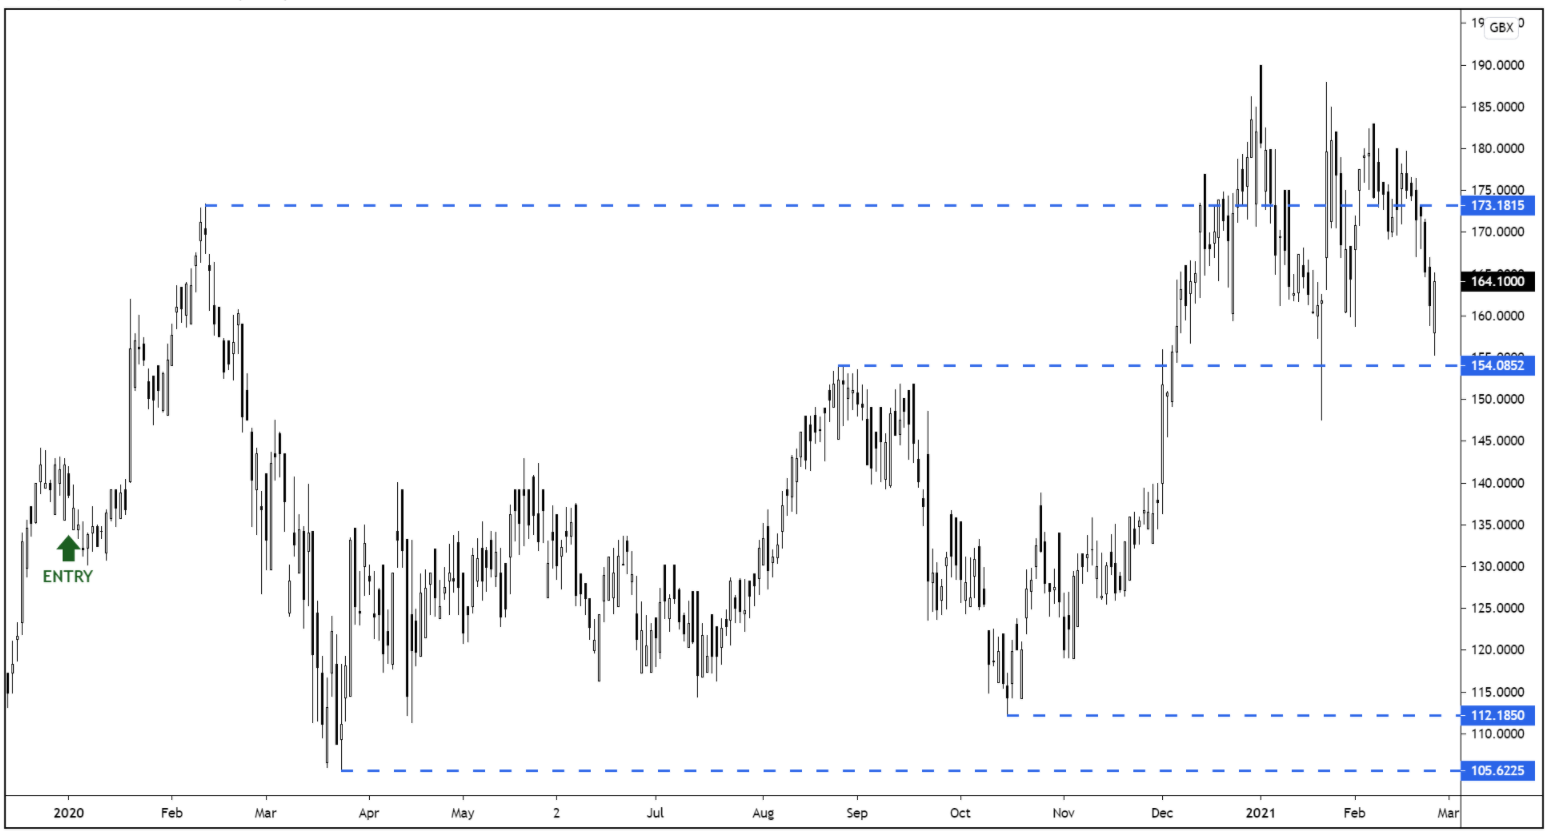
Learning Technologies (LTG) announced another acquisition this month with the purchase of US-based learning platform Bridge for $50m.
Bridge achieved revenues of $21m in 2020 and represents LTG’s seventh acquisition since the £81.8m placing in May last year.
LTG expects Bridge to become earnings accretive from H2 2021 and to align with its typical software division margins by early 2022.
The acquisition statement said:

“Bridge has more than 800 customers which combined with LTG’s global customer base represents a compelling cross-selling opportunity.”
The shares are currently pin-balling between support at 154p and resistance at 173p. This prolonged periods of consolidation are quite normal in AIM stocks as we remain confident that LTG’s long-term bullish trend structure will prevail.
LTG Daily Candle Chart
Clinigen revenue growth at top end of guidance
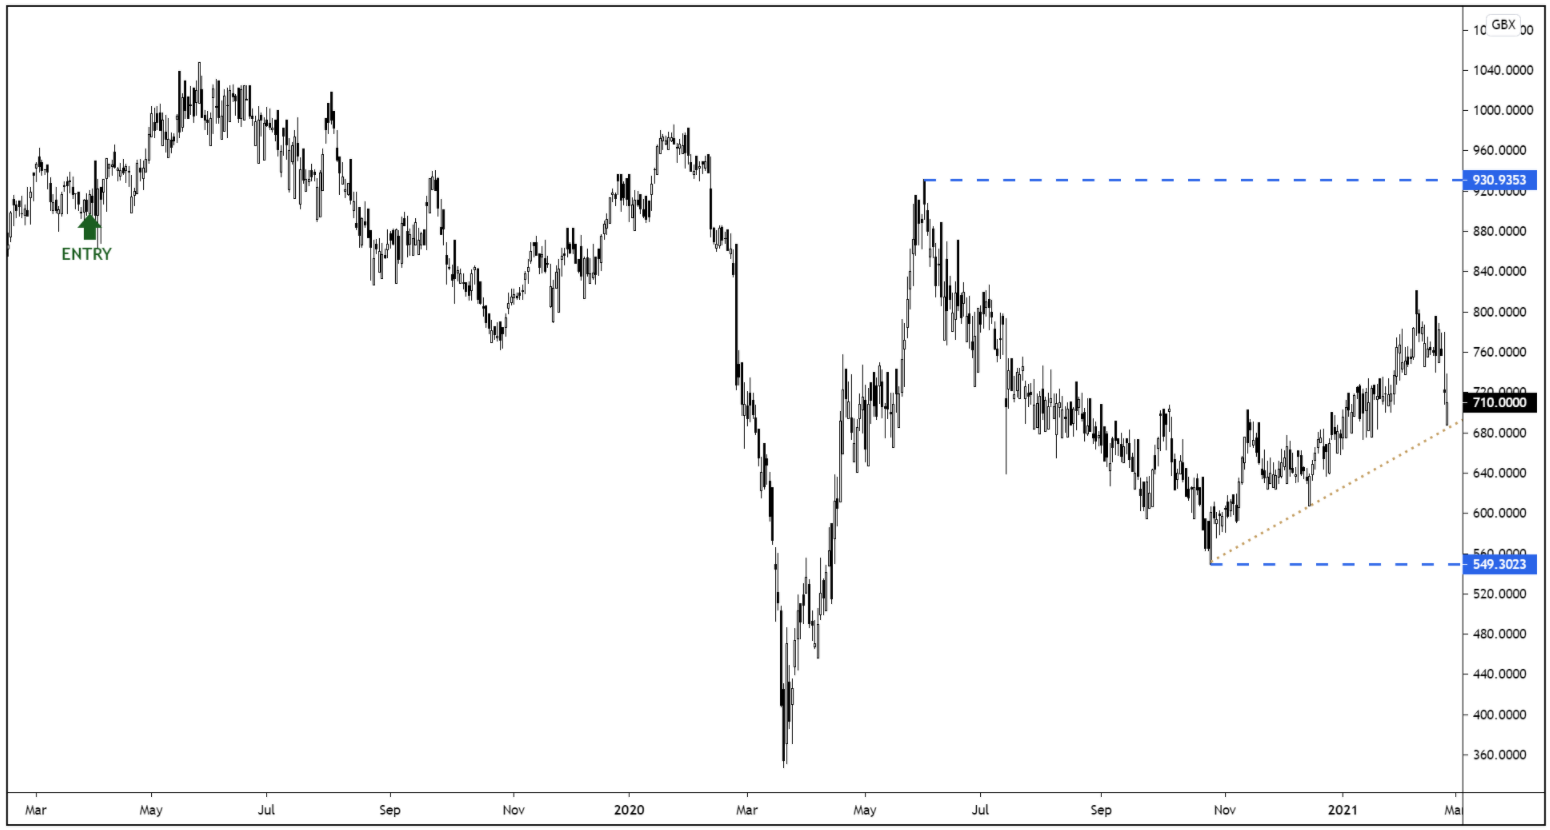
Speciality pharma company Clinigen (CLIN) released a solid set of half-year results this week…
Full-year organic revenue growth is expected to come in at the upper end of previous guidance, driven by growth in both its services and product units.
Pre-tax profits fell 8% year-on-year to £22.7m in the six months ended 31 Dec 2020, while revenue rose 3% to £231.9m during the same period.

Clinigen kept their interim dividend unchanged but net debt had widened during the half to £351.5m from £329.7m twelve months prior.
CEO Shaun Chilton commented:
“Like many companies focused on hospital-based treatments, and oncology in particular, we have seen some effect on our operations during the period, but the diversity of our business model has helped us to mitigate much of the disruption and we have ended the first half ahead of market expectations…
“We may not be immune to the impact of the pandemic, but our business model gives us a degree of resilience.”
Clinigen’s share price has pulled back to the new ascending trendline and we’ll be looking for this to hold and for the recent series of higher swing lows to continue.
CLIN Daily Candle Chart
Tracsis in-line and on-track with first half numbers
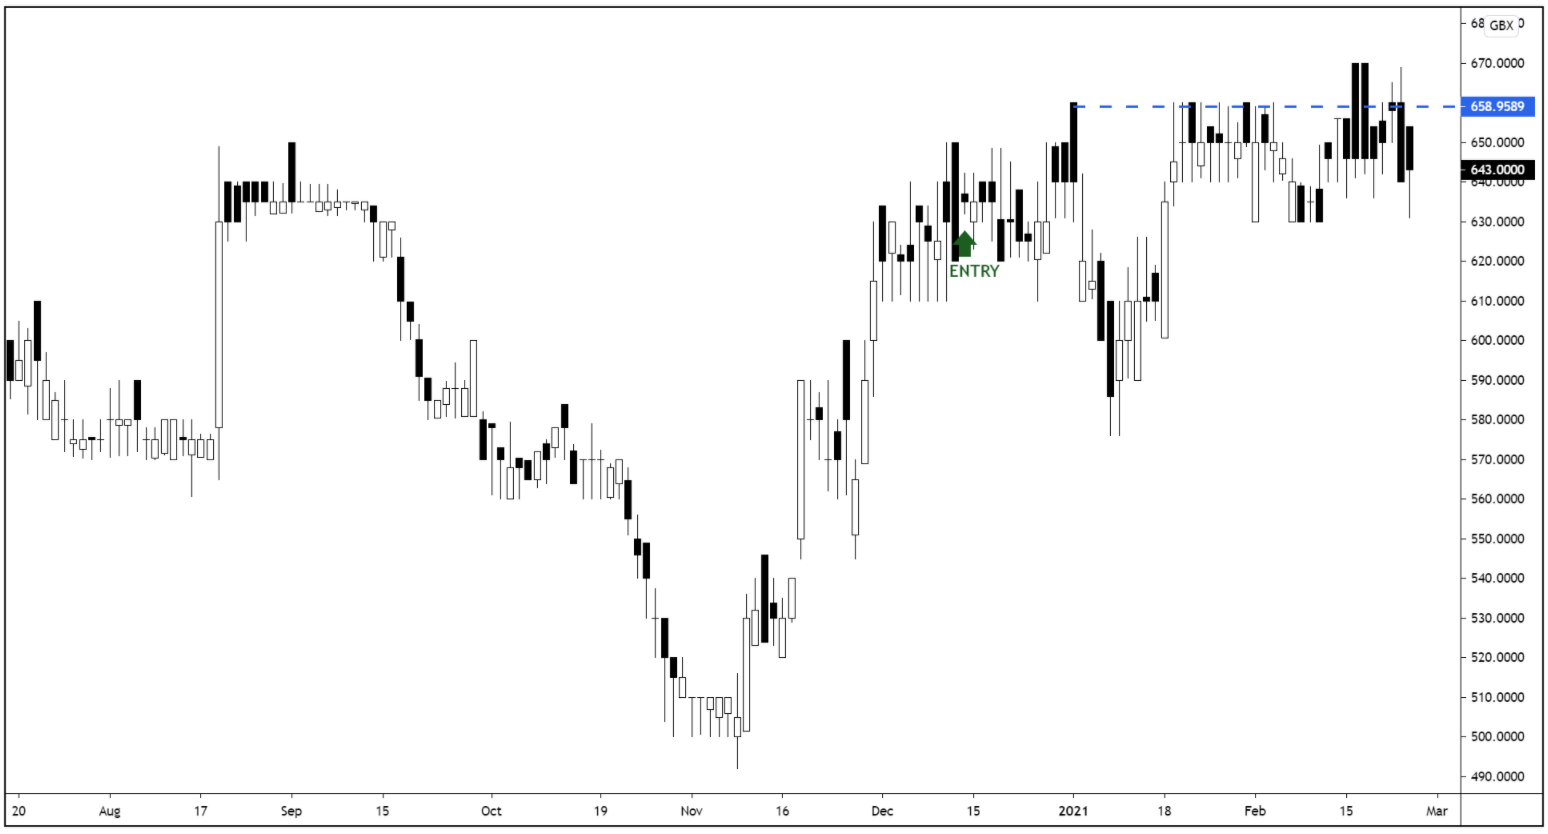
Tracisis (TRCS) said trading for the six months ended January 31 2021 was “in-line with the boards expectations”.
In Tuesday’s trading update, the traffic and transport data specialist said it is seeing “high activity levels across large parts of the group” and expects to post revenue of £22m, below the prior year’s £26.4m, due to lower sales from its Events and Traffic Data units amid ongoing COVID-19 restrictions.
Activity levels are expected to steadily increase, and this week’s positive news from the Government regarding vaccine efficacy and pathway to reduce restrictions is only a positive for the stock.
Tracsis cash position remains strong at around £21m and the firm continues investing it its technology base, as well as in pursuing acquisition opportunities.
The shares have been treading water just below resistance at 659p. Given how tight this consolidation phase has become, it looks like the shares are gearing up for an explosive directional move.
TRCS Daily Candle Chart
Disclaimer:
All content is provided for general information only and should not be construed as any form of advice or personal recommendation. The provision of this content is not regulated by the Financial Conduct Authority.