29th Jun 2023. 9.02am
Regency View:
BUY H&T Group (HAT)
Regency View:
BUY H&T Group (HAT)
Pawnbroking booms amid cost-of-living crisis
With around a third of adults finding it difficult to afford their rent or mortgage payments, it’s no surprise that the pawnbroking industry in the UK is experiencing a boom.
The ever-increasing cost of living has pushed more people to seek out small loans, especially with limited options due to stricter regulations on high-interest lenders.
As a result, companies like H&T Group (HAT), the UK’s largest pawnbroker, offering loans secured against assets like jewellery and watches, have seen their sales and profits soar.
The stock is currently in a sweet spot between value and growth and we believe the addition of H&T will bolster the ‘recession proof’ side of our AIM Investor portfolio.
Soaring profits and pledge book growth
As the market leader in the pawnbroking industry, H&T has seen significant levels of growth during the last year.
“The need of people to borrow has returned … but that need has returned into a market where the supply of small sum credit is massively reduced” said H&T chief executive Chris Gillespie when commenting on a stellar set of Full Year 2022 results in March.
H&T’s strong brand recognition and customer trust, evident from their five-star rating on Trustpilot, have positioned them well to capitalise on this market of limited consumer choice.
H&T’s pledge book, which represents the value of assets customers pledge as collateral for loans, jumped more than 50% to over £100m. This increase reflects the soaring demand for pledge lending.
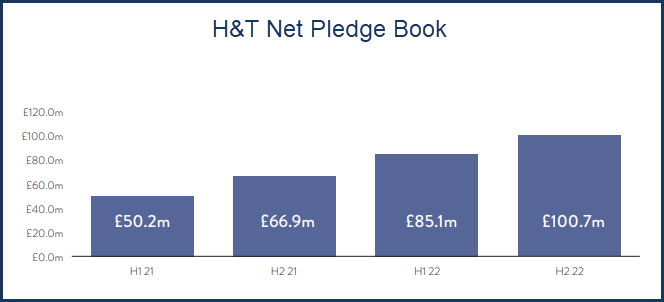
As the pledge book expands, it opens up the potential for higher interest income and fees generated from those loans. This substantial growth in the pledge book has played a significant role in H&T’s impressive profit growth, nearly doubling from £10m in the previous year to £19m in 2022.
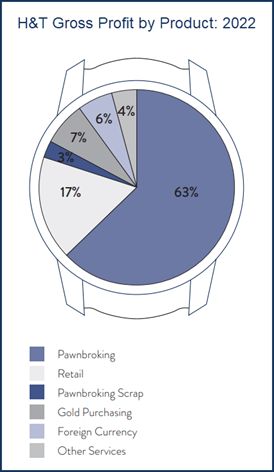
While pawnbroking remains a core aspect of H&T’s business, they have successfully diversified their services to include the retailing of new and pre-owned jewellery, as well as foreign currency exchange. This strategic diversification allows H&T Group to generate income from multiple sources, reducing their reliance on any single business segment.
In addition to the growth in pledge lending, H&T has experienced a sharp rise in sales of retail jewellery and watches, amounting to £45.2m in 2022 compared to £36.2m in 2021. Furthermore, they have witnessed significant growth in foreign currency net income, surpassing pre-Covid levels at £5.7m.
Overall, H&T Group’s expansion into new business segments, combined with their strong performance in pledge lending and retail sales, has propelled their financial success and solidified their position as a market leader in the industry.
Unlocking the sweet spot between value and growth
H&T Group’s financials and forward-looking valuation position the company in an ideal sweet spot between value and growth.
First and foremost, H&T boasts a double-digit Operating Margin and Return on Equity (RoE), indicating that it is a high-quality business with a sustainable competitive advantage.
In terms of valuation, the stock trades at an attractive forward price-to-earnings (PE) ratio of 7. This compares favorably to both other defensive stocks and the broader market.
Moreover, when we consider H&T’s single-digit PE ratio in relation to its projected earnings per share (EPS) growth of 22.1%, we arrive at a price/earnings-growth (PEG) ratio that would make renowned investors like Jim Slater, Peter Lynch, and John Neff proud.
Additionally, H&T offers a well-covered dividend of 15p per share (FY22), which is expected to increase to 20.9p in FY23 and 25.1p in the following year. This places H&T’s forward dividend yield at over 5%.
Overall, H&T’s solid financials, favourable valuation metrics, and attractive dividend yield make it a compelling investment opportunity at the intersection of value and growth.
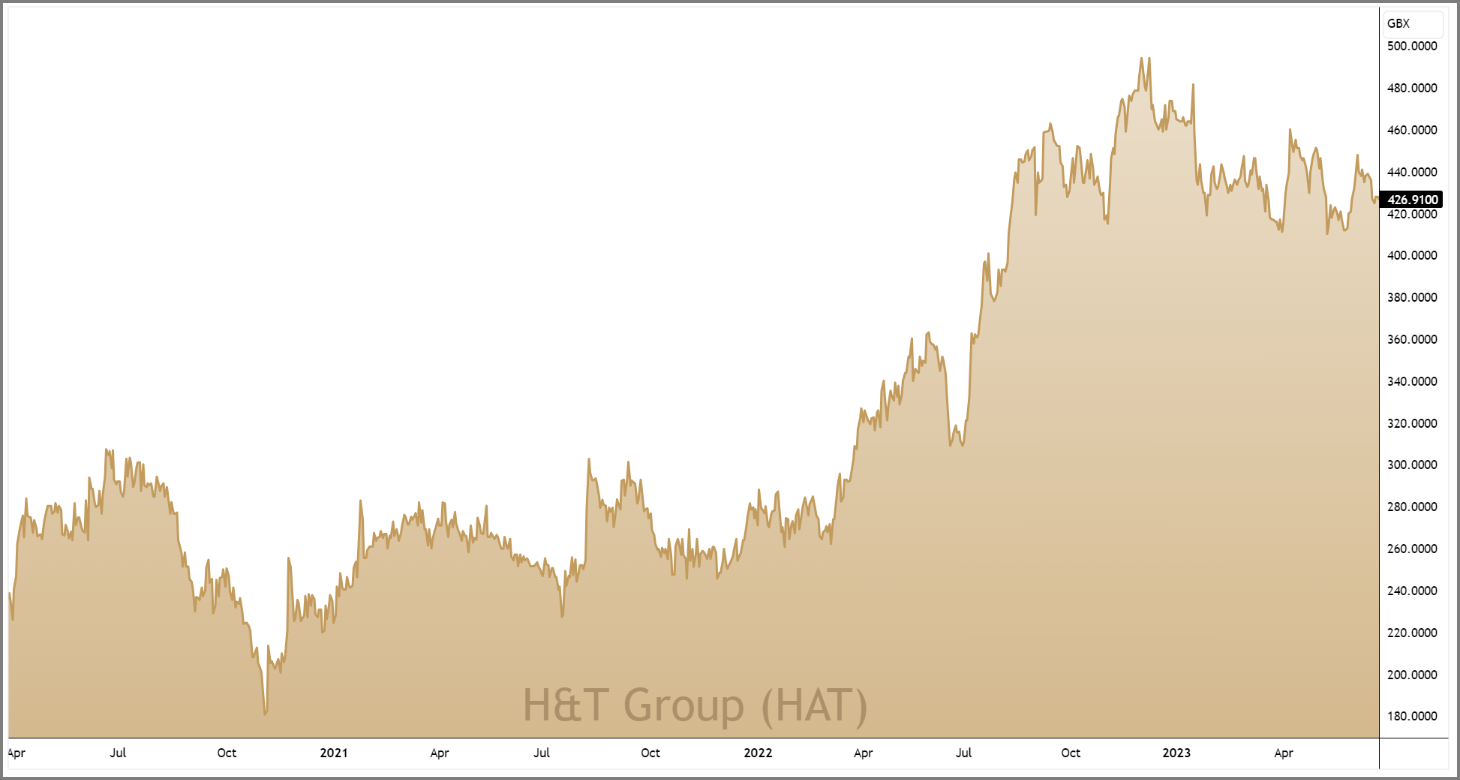
Bull flag forming
On the price chart, H&T’s share price has been in consolidation mode this year.
After a stellar run in 2022, which saw the stock double in value, a prolonged period of mean reversion is healthy.
If we look at the weekly candle chart (right) we can see that the recent consolidation phase is forming lower swing highs into a horizontal area of support – creating a descending triangle pattern which is a type of bull flag.

Patterns of this nature have a statistical tendency to resolve themselves in-line with the dominant long-term trend, which in H&T’s case is firmly bullish.
And positioning ourselves within the bull flag pattern leaves us with 20% headroom to last years’ highs.
HAT 3-Year Chart
Disclaimer:
All content is provided for general information only and should not be construed as any form of advice or personal recommendation. The provision of this content is not regulated by the Financial Conduct Authority.