23rd Apr 2026. 9.08am

Regency View:
BUY Frontier Developments (FDEV)

Regency View:
BUY Frontier Developments (FDEV)
From Recovery to Re Rating
There is a certain type of AIM stock that the market gives a second chance to, but only once the numbers prove the turnaround is real. Frontier Developments (FDEV) has already made that transition, moving from losses back into profitability, but after a sharp rally through 2025, the shares have pulled back. The key question now is whether this is momentum fading or simply the market resetting expectations.
What makes this setup compelling is that the underlying business has continued to improve while the share price has cooled. Revenues are growing again, margins have recovered, and cash generation is building, suggesting this looks less like a peak and more like consolidation within a broader recovery.
From Volatility to Visibility
Frontier Developments builds and publishes simulation-based video games, focusing on long-life franchises such as Jurassic World Evolution and Planet Zoo. These are not one-off hits. They are ecosystems, designed to generate recurring revenues through downloadable content, expansions, and ongoing player engagement.
That shift towards a more durable revenue model is now clearly visible in the numbers. CMS titles account for around 90% of total revenue, and this segment delivered growth of 52% in the latest update. This is important because it reduces reliance on unpredictable blockbuster launches and replaces it with a more stable and scalable base.
The success of Jurassic World Evolution 3 highlights how this model works in practice. The title drove strong engagement and delivered a record Christmas trading period, while Planet Zoo has continued to perform as the company’s highest grossing game. With a sequel already planned for FY27, Frontier is increasingly building a portfolio of repeatable franchises rather than chasing one-off successes.

Growth Returns, Margins Follow
The latest numbers confirm that the business has moved firmly back into growth mode. For the six months to November 2025, revenue rose 26% to £59.6m, while adjusted operating profit increased 76% to £7.8m. That level of operating leverage is one of the most attractive features of the model, with profits recovering faster than revenues.
On a trailing basis, revenues now sit at £103m, with operating profit at £15.9m and net profit at £20.0m. Margins have also recovered meaningfully, with operating margin improving to 15.5% from deeply negative levels just two years ago.
Returns are following the same trajectory. Return on capital is now 14.1%, while return on equity has reached 22.7%, both signalling a business that is once again generating value rather than destroying it.
Looking ahead, expectations are more measured but still constructive. Forecast earnings growth for the next year sits at around 3.3%, reflecting a more normalised phase after the initial recovery. That moderation is worth noting, but it also suggests the business is moving into a more stable footing rather than relying on one-off spikes.
Valuation: Cheap for the Quality on Offer
Despite the recovery, valuation remains supportive. The shares trade on a forward P/E of 15.1, while the EV/EBITDA multiple sits at just 2.9. That is low for a software-style business with improving margins and a growing base of recurring revenues.
Cash generation adds another layer to the story. Free cash flow has improved sharply, with free cash flow per share rising to 51.9p on a trailing basis. That leaves the shares trading on a price to free cash flow multiple of just 6.7, which stands out given the improving quality of earnings.
The balance sheet is also in good shape. Frontier holds £40.1m in cash and remains in a net cash position of £21.5m, giving it flexibility to invest in future titles while limiting financial risk.
Broker sentiment reflects this improving picture. The average price target sits at 591p, implying meaningful upside from current levels, although as always, analyst forecasts should be treated as directional rather than definitive.
Technical Analysis: A Change in Trend Meets Support
From a technical perspective, the shares have already undergone a clear change in trend. After several years of underperformance, the stock moved into a sustained uptrend through 2025, supported by improving fundamentals and renewed investor interest.
The recent pullback needs to be viewed in that context. Price has retraced into a prior area of resistance, which is now showing signs of acting as support. This type of behaviour is typical of strengthening trends, where former ceilings become floors as the market reassesses value.
Momentum has cooled in the short term, with the shares sitting around 35% below their 52-week high and slightly below the 200-day moving average. However, they are holding around the 50-day, suggesting the market is stabilising rather than breaking down.
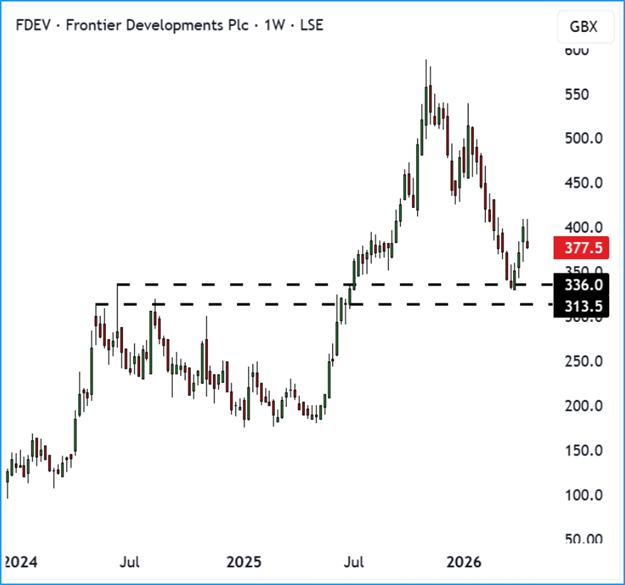
This sets up a familiar dynamic. Short-term weakness has reset positioning, but the longer-term structure remains intact. If buyers continue to defend this zone, it reinforces the idea that this is consolidation within a developing uptrend rather than the start of a reversal.
The Setup
Frontier Developments is no longer a turnaround story in theory. The numbers now support it. Revenues are growing, margins have recovered, returns are improving, and the balance sheet remains strong.
The share price, however, has paused. That disconnect is what creates the opportunity.
This is now a stock where the market is asking a different question. Not whether the turnaround is real, but whether it can continue. If the company can sustain its current trajectory and deliver against its pipeline, the current consolidation may prove to be exactly that, a pause before the next leg higher.
Five Key Takeaways
1. Turnaround Confirmed: Revenues, profits, and margins have all recovered, showing the business is back on a stable footing.
2. Quality Shift: The move towards CMS titles is driving more predictable and repeatable revenues.
3. Cash Strength: A net cash position and strong free cash flow provide financial flexibility and downside protection.
4. Valuation Gap: The shares remain modestly priced despite improving returns and profitability.
5. Trend Intact: The pullback into support suggests consolidation within a broader uptrend rather than a reversal.
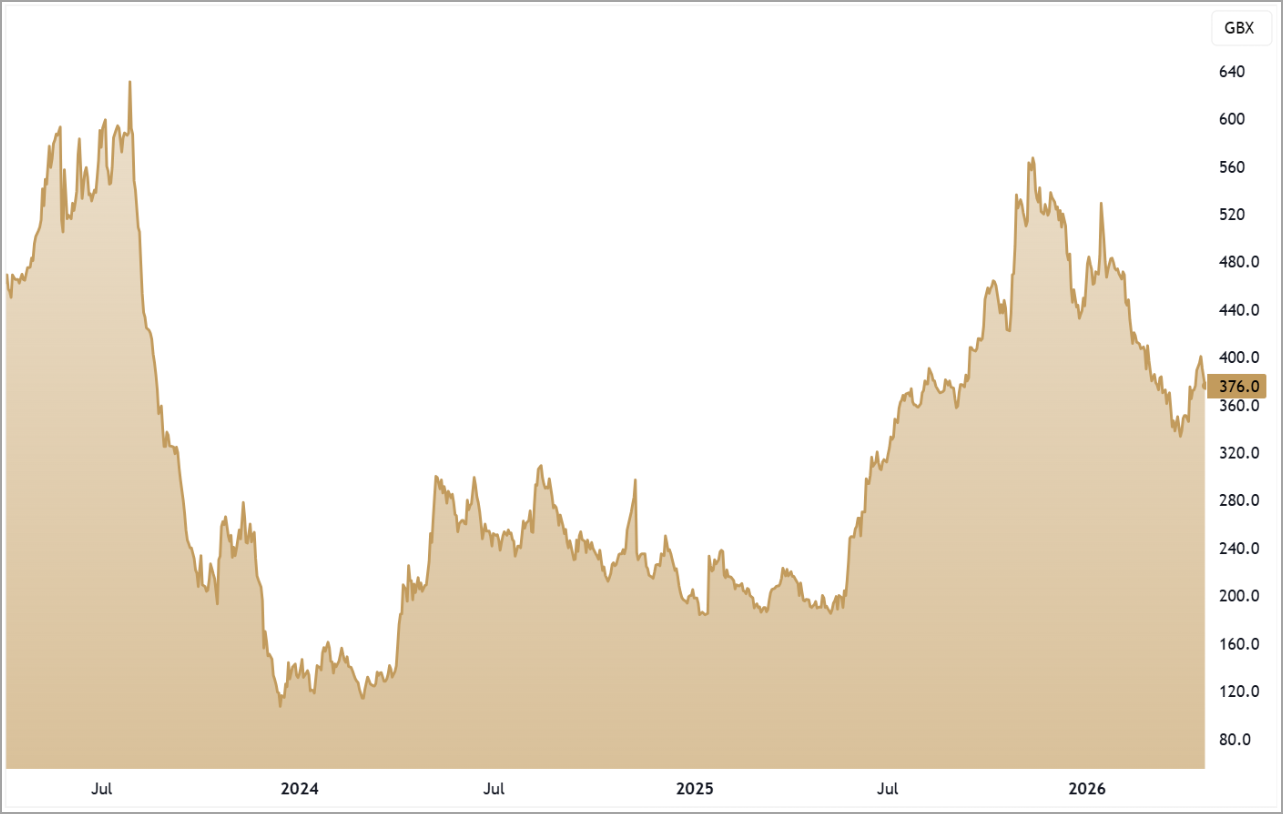
FDEV 3-Year Chart
Disclaimer:
All content is provided for general information only and should not be construed as any form of advice or personal recommendation. The provision of this content is not regulated by the Financial Conduct Authority.