1st Jun 2023. 8.59am
Regency View:
BUY Yu Group (YU.) Second Tranche

Regency View:
BUY Yu Group (YU.) Second Tranche
Cashflow king Yu Group remains overlooked
We’ve been fans of fast-growing corporate energy supplier Yu Group (YU) for a while now.
The business is going from strength to strength and enjoying the benefits of scale that come with rapid growth.
In recent months the shares have pulled back to key support levels, and having released a bullish trading statement this week we believe the time is right to snap up a second tranche.
A quick recap…
Yu is a multi-utility supplier focused on small and medium-sized businesses across the UK – clear here to see our original Buy Yu Group recommendation.
Yu have invested heavily in digital infrastructure and smart metering. This is allowing the business to improve customer experience, increase cash collection efficiency and reduce bad debt levels as it grows.
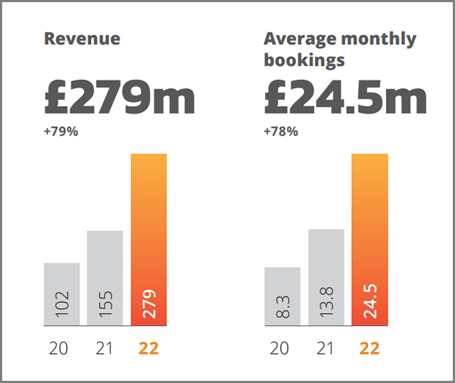
Last year, Yu’s revenue surged 79% to £278.6m (FY22) and adjusted earnings (EBITDA) more than tripled to £7.9m (FY22).
The UK B2B utility market is worth an estimated £50bn, giving plenty of significant scope for Yu’s rapid organic growth to continue.
Yu have been clear in their objective to “scale the Group to beyond the £500m mark of revenue”. And at current growth rates north of 40% (CAGR), Yu is on course to achieve this target by 2025.
Growth momentum continues
On Wednesday, Yu released a trading update which stated that last year’s growth momentum had continued this year…
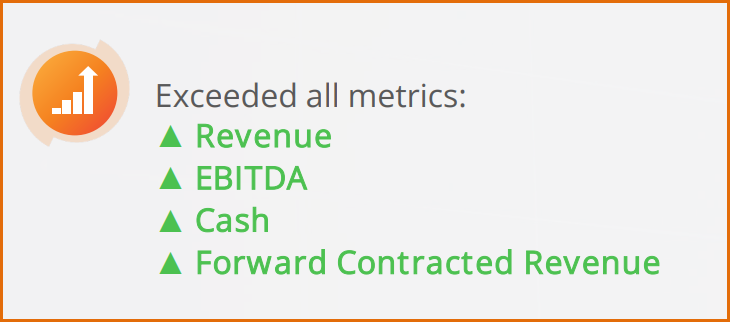
Yu said key performance indicators of revenue, profitability and cash generation were “all showing very strong growth”.
Yu also said the run rate growth of average monthly bookings achieved in Q4 2022 has continued into 2023 due to “pent-up demand resulting from softening commodity markets”.
As a result, Yu has seen an increase in customers contracting with the company, providing additional revenue visibility not only for the current fiscal year but also for the future.
Yu said the strategic investment in its ‘digital by default’ strategy, combined with its ongoing smart metering roll-out, had established a scalable platform, enabling it to achieve significant cost-efficiency benefits.
Yu significantly below Fair Value
For a business growing at break-neck speed and with increasing profitability, Yu’s share price looks too cheap.
The stock trades on a forward PE of 8.2, which looks very reasonable given Yu’s forecast growth in earnings per share (EPS) of 61% over the next year.
Another way of reflecting the disparity between Yu’s market price and its growth potential is the PEG ratio (price to earnings growth) – Yu has a PEG of just 0.2, where anything less than 0.9 is considered attractive.
There are also Yu’s significant cashflows to consider when assessing its valuation…
Yu generated £80.9m in operating cashflow last year of which £79.7m flowed through into free cash.
This has not only created a strong, debt free balance sheet, but also puts Yu on a Price to Free Cashflow ratio of 5.3 (TTM), which compares very well to its peer group and the wider market.
And if we model what would be a ‘fair price’ for Yu based on future cashflows, we get a Fair Value per share of £25.17 – significantly higher than Yu’s current share price of less than £6.
Prices pullback to support
Managing the market’s expectations is more art than science, and Yu’s CEO Bobby Kalar is learning this the hard way.
He was very quick to hype up Yu’s stellar performance during the first quarter of the year, and the shares rallied exponentially higher on the promise of continued earnings upgrades.
Exponential price rallies are rarely sustainable and despite releasing a “recording breaking” financial performance in March, the shares dropped sharply – indicating that market expectations ran ahead of themselves.
We’ve waited patiently for the hot air of market expectations to dissipate, and Yu’s share price is now starting to test some key support levels.
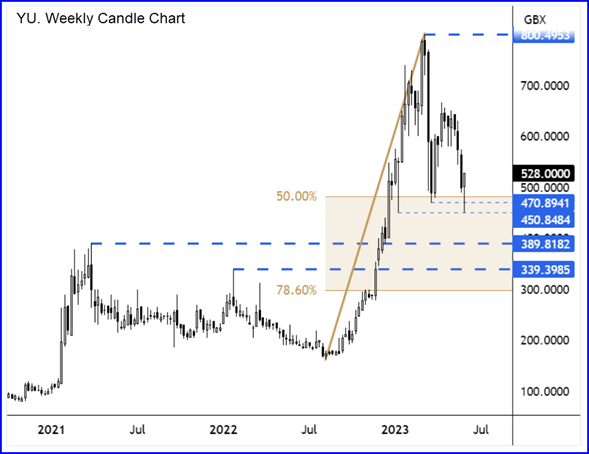
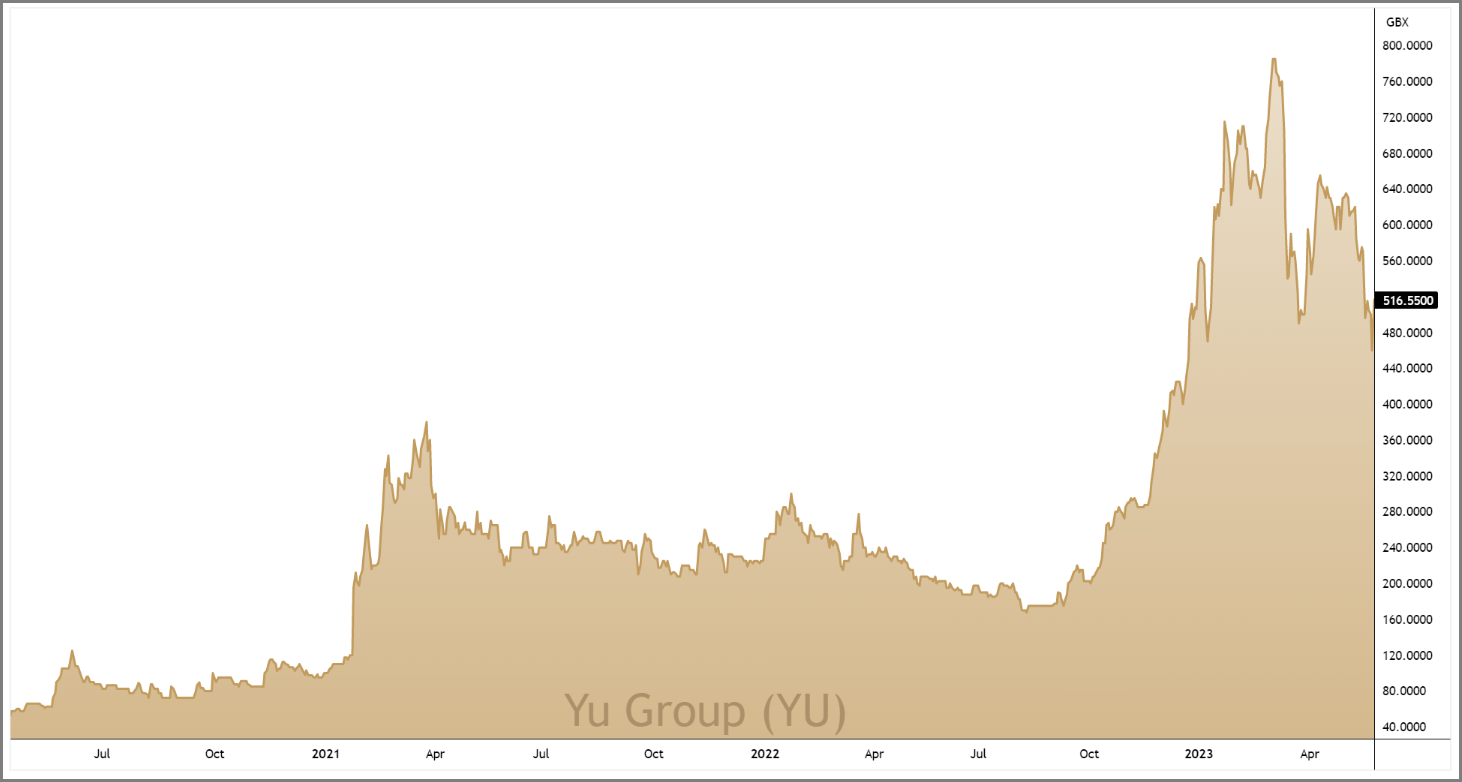
Current price action is testing the swing support levels formed this year at 470p-450p. And below this are key support levels created by the April 2021 and January 2022 highs (see weekly candle chart right).
And for those of you who follow Fibonacci analysis, these support levels are clustering within the 50%-78.6% retracement area of the August 2022 – March 2023 rally.
This week, the stock has rallied from support on the back of Wednesday’s trading update.
The market’s bullish reaction indicates that expectations have realigned with Yu’s strong fundamentals, presenting an opportunity to snap up a second tranche at attractive levels of risk reward.
YU 3-Year Chart
Disclaimer:
All content is provided for general information only and should not be construed as any form of advice or personal recommendation. The provision of this content is not regulated by the Financial Conduct Authority.