13th Feb 2020. 8.57am

Regency View:
BUY Highland Gold Mining (HGM)
Regency View:
BUY Highland Gold Mining (HGM)
The Little Russian Miner Paying Big Dividends
Last month, we took profits in Trans-Siberian Gold for stock specific reasons. The subsequent reduction in our gold exposure is something we’re looking to address today…
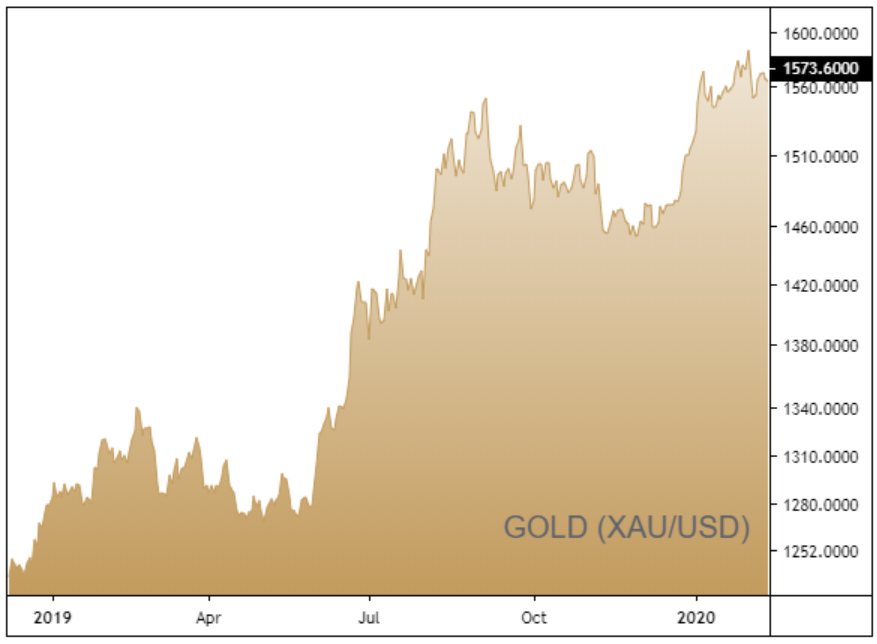
We were bullish on gold throughout 2019 and our outlook hasn’t changed. The enduring downtrend in Chinese economic growth estimates due to the coronavirus outbreak and US attention on trade deficits during an election year are all positive short-term catalysts for the yellow metal.
The technical backdrop is also very bullish with prices breaking and holding above $1,540 resistance at the start of the year, forming a powerful long-term uptrend.
Our favoured gold play on AIM is Highland Gold Mining (HGM) which has a high-quality production base, low all-in sustaining costs and a sizeable dividend yield.
With a market cap north of £700m and annual gold production of more than 300,000oz, HGM is comfortably the largest gold miner on AIM. The firm operates a “no hedge” policy so a position in HGM will provide our AIM Investor portfolio with plenty of exposure to the underlying commodity.
Pipeline of High-Grade Development Projects
HGM’s operations are located around three main hubs in the Khabarovsk, Zabaikalsky and Chukotka regions of Russia, as well as in Kyrgyzstan in Central Asia. The firm currently has four operating mines, three development projects, and three exploration properties.
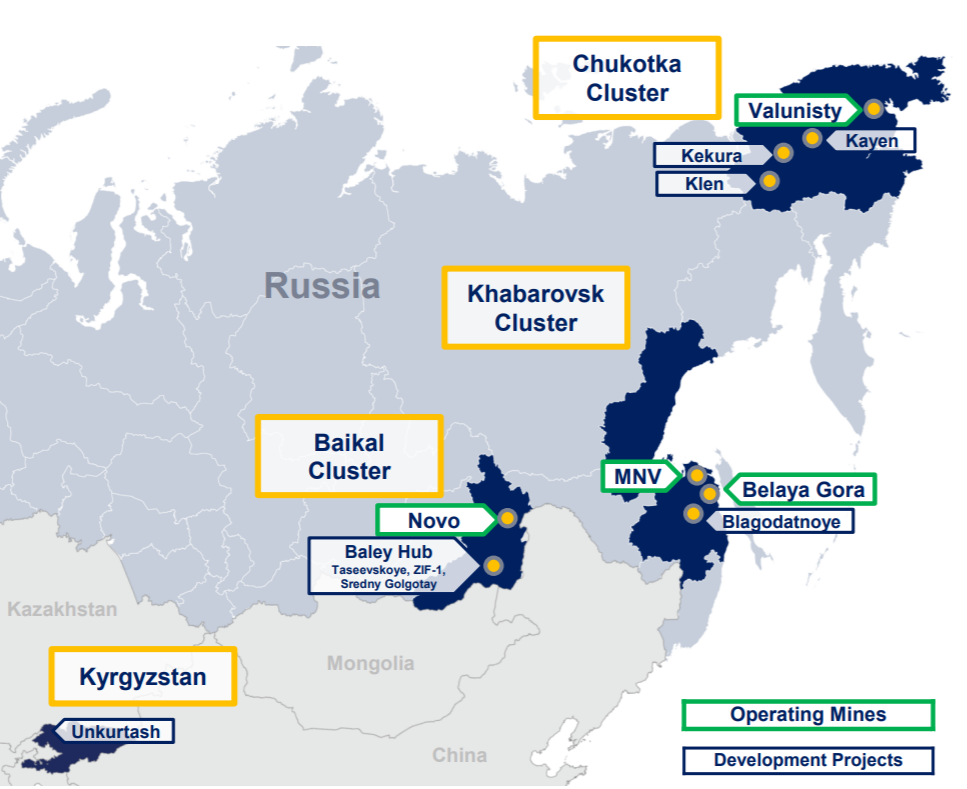
Transitioning production away from HGM’s aging Mnogovershinnoye (MNV) mine, which currently produces 112,000oz per annum, represents the miners biggest challenge. So far, management have done an excellent job at extending the life of MNV as well as keeping the development pipeline on budget and on schedule.
The star in HGM’s development portfolio is the Kekura mine situated in the prolific Chukotka region and has production capabilities of 170,000oz per annum. Initial stripping and mining started in November last year with full commercial production set for 2023. HGM have also commenced drilling on several additional targets in the broader Kekura licence area to identify additional open pit reserves.
Alongside the Kekura development HGM have launched near-mine exploration projects at MNV and acquired three adjacent greenfield licences.
Strong Q4 Production
In January HGM released a strong set of Q4 and full-year production numbers, giving the firm plenty of momentum heading into 2020.
Gold production in Q4 increased to 83,429oz, up from 75,038oz the previous quarter, driven by an impressive performance from MNV which outperformed expectations on the back of improved grades and higher processing volume.

The strong end to the year saw HGM’s 2019 production levels hit 300,704oz, an increase of 12% year on year, exceeding previous guidance. Looking forward, the firm said that it expects no significant production growth in 2020 and output will remain between the 290,000oz and 300,000oz guidance range.
Who Says Gold Doesn’t Pay Dividends?
A key advantage of investing in gold stocks instead of the underlying commodity is dividend income and HGM is punching well above its weight in this area.
The miner has an impressive eight-year track record for paying out sizeable dividends and currently trades on a forecast dividend yield of 5.3% – comfortably outstripping the 3% currently offered by most UK mid-caps.
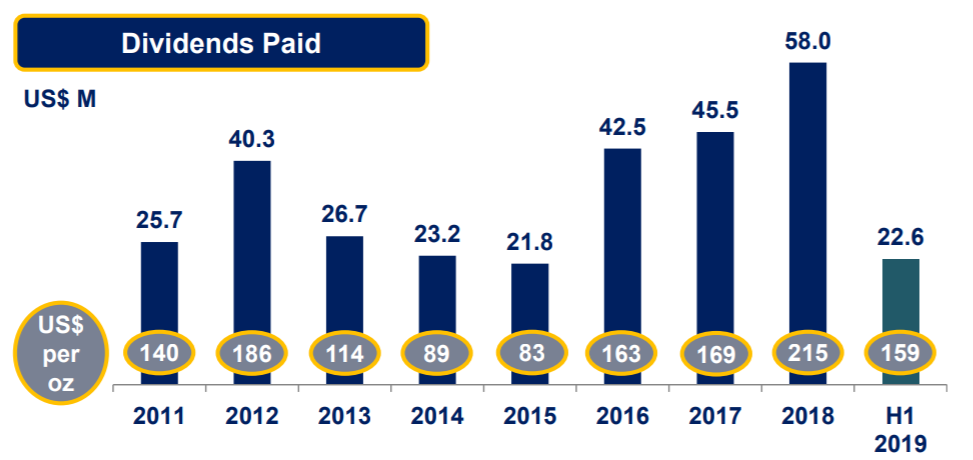
Whilst the 5p interim dividend (H1 2019) is a slight reduction on the equivalent handout from last year, HGM’s policy of paying out 20% net cash flow from operating activities should see the final payment shoot up, thanks to the robust gold price.
Along with income, HGM offers the comfort of a single digit forward PE multiple (8.3) and a top quartile return on capital of 10.1%.
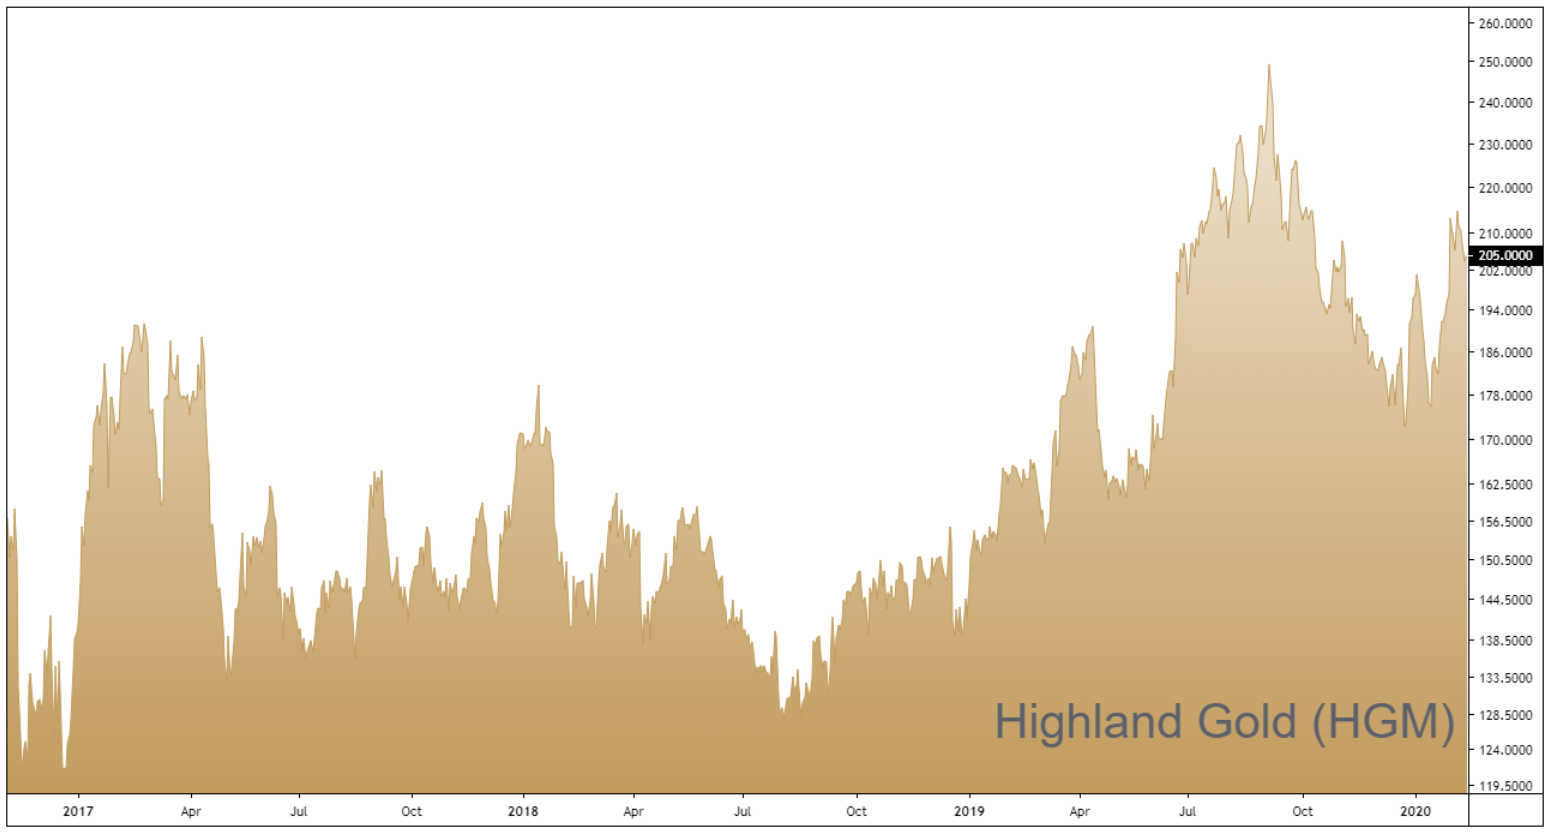
New Swing High Signals Uptrend Has Resumed
When it comes to the art and science of technical analysis, it is often the simplest concepts which are the most robust and effective.
There’s a myriad of technical indicators for telling investors when a trend has changed but, in our opinion, the most effective method is to map the inflection points or ‘swings’. During the later during the later half of 2019, HGM experienced a deep and sustained retracement, carving out a series of lower swing highs and lows on the daily candle chart.
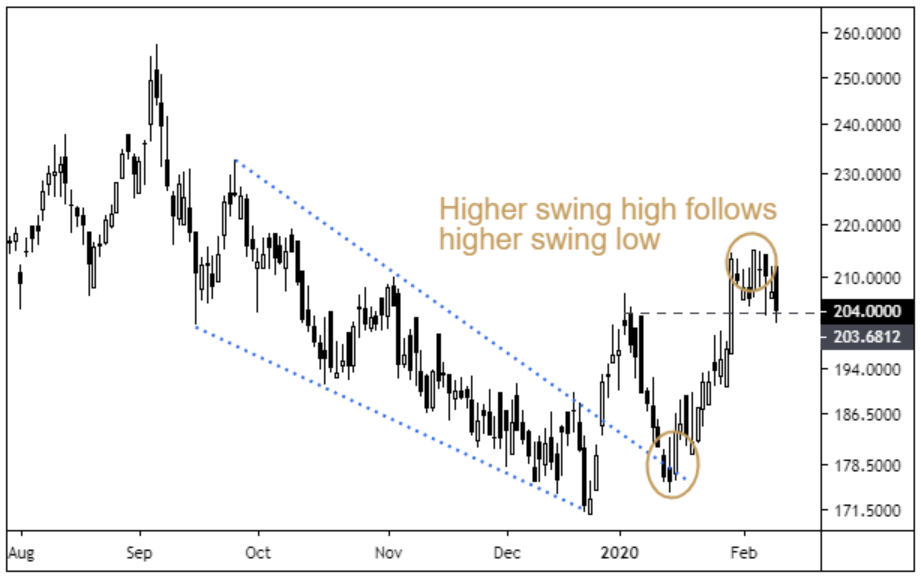
However, since the turn of the year we’ve seen this series of lower swing highs and lows broken. Having formed a higher swing low in January, last week’s break above 205p formed a higher swing high, providing us with confirmation that HGM’s long-term uptrend had resumed. The timing now looks right to add HGM to our AIM Investor portfolio.
HGM 3-Year Chart
Disclaimer:
All content is provided for general information only and should not be construed as any form of advice or personal recommendation. The provision of this content is not regulated by the Financial Conduct Authority.