13th Jun 2025. 10.34am

Weekly Briefing – Friday 13th June
| Market | Movement this week (%)* |
|---|---|
| FTSE 100 | +0.02% |
| FTSE 250 | -0.21% |
| FTSE All-Share | +0.01% |
| AIM 100 | +0.26% |
| AIM All-Share | +0.63% |
* Price movement from Monday's open at 8am

Regency View:
Weekly Briefing – Friday 13th June
Market Overview
Dear Investor,
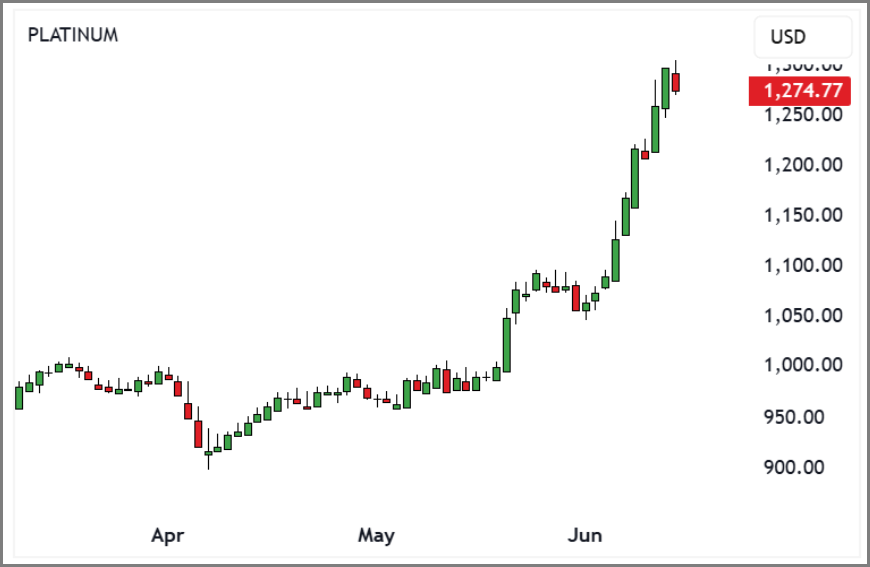
Silver and platinum have taken centre stage this month, breaking higher as investors look beyond gold in search of value and protection…
With gold already up 25% year to date and starting to look fully priced, attention is turning to the rest of the precious metals space. Silver has jumped to a 13 year high above 36 dollars per ounce, while platinum is enjoying its strongest monthly performance since 2008 with an 18% gain so far in June.

Crucially, this isn’t just hot money chasing headlines. Both metals are drawing support from genuine supply and demand imbalances. Silver backed ETFs have seen more than 300 tonnes of inflows already this month, more than double May’s tally. Platinum is finally beginning to reflect years of tight supply and structural deficits. Stockpiles that once kept prices capped are now running low. That’s helped shift sentiment from indifference to urgency.
It also helps that silver and platinum aren’t just shiny lumps of metal they’re workhorses of the modern economy. Silver is used in solar panels, batteries and advanced manufacturing, while platinum remains a critical component in catalytic converters. With EV adoption slower than forecast, demand from hybrid and petrol vehicles remains strong. High gold prices are even giving platinum a leg up in jewellery markets, particularly in China, where imports are picking up again.
The broader takeaway is that this isn’t just a catch up move it may be the start of a deeper rerating. Both metals have quietly built strong supply demand stories that are only now being recognised by the wider market. With growing investor flows and signs of renewed industrial appetite, the momentum may have more room to run.
Wishing you a fantastic weekend,
Tom
Market Movers
On the rise: Bellway (LSE:BWY) +14.6% on the week
Bellway’s share price has broken higher this week following a strong spring trading update that’s helped restore confidence in the housebuilder’s growth outlook.
Reservations per outlet held steady year-on-year, but the total forward order book is now 7.7% higher than this time last year, and the group is fully sold for FY25. That visibility gives the company a solid base to hit its upgraded volume target of 8,600–8,700 homes, with margins now expected to approach 11%.

Crucially, Bellway is not just building for growth it’s building more efficiently. The company has nearly doubled its land acquisitions year-on-year, taking advantage of market conditions to lock in supply while maintaining capital discipline. At the same time, it’s improving its average selling price through smarter product mix and has reaffirmed its goal to increase return on capital employed, all while keeping net debt low and dividend cover healthy.
With housebuilding sentiment gradually improving, Bellway stands out as a business with a clear plan, a healthy balance sheet, and strong operational momentum. Management is focused on efficiency as much as expansion, and a full-year dividend underpinned by 2.5x earnings cover reinforces confidence in its ability to navigate the cycle while delivering shareholder value.
REGENCY VIEW:
Bellway’s share price is quietly climbing, supported by a strong forward order book and a disciplined land acquisition strategy that underpins steady volume growth. With improving revenues, stable margins, and a reliable dividend yield, the company is steadily carving out value for investors who appreciate steady, well-managed progress.
Share in value retailer B&M continued to fall this week following a weak set of preliminary results earlier this month. While the company delivered revenue growth of 3.7% to £5.6 billion, the rest of the income statement pointed in the opposite direction.
Adjusted operating profit dipped 1.8% to £591 million, profit before tax fell 13% to £431 million, and adjusted diluted earnings per share declined 6.7% to 33.5p. Investors were quick to react. The stock dropped 12.9% in a single session following the results last week, as the market priced in softer profitability and weaker cash generation.

Post-tax free cash flow fell 18.5% to £311 million, mainly due to higher inventory levels, while statutory cash generated from operations also slipped 9.1%. Net debt rose to £781 million, pushing leverage marginally higher. Although B&M raised its ordinary dividend by 2% to 15p and highlighted a strong return on capital employed at 30.4%, the overall tone was more defensive than bullish. Rising costs, increased depreciation, and heavier financing charges appear to be eating into the group’s efficiency, despite a solid gross margin improvement in the core UK business.
Store growth and operational investments continue, with 70 new stores opened across the UK, France, and Heron Foods, and a new import centre due to open this summer. But with margins under pressure and consumer confidence still patchy, the near-term outlook remains mixed. A change of leadership is also on the cards, with incoming CEO Tjeerd Jegen set to take over later this month. That transition may be welcomed if it brings fresh energy to the strategy, but for now, investors are focused on the numbers and the numbers are telling a tougher story.
REGENCY VIEW:
B&M looks cheap on paper with a sub-8 forward PE and an 8% yield, but the market’s clearly not buying the story right now. Momentum is firmly against it after a sharp post-results sell-off, and with earnings under pressure and free cash flow trending lower, it may take more than just value screens to turn sentiment.
Sector Snapshot
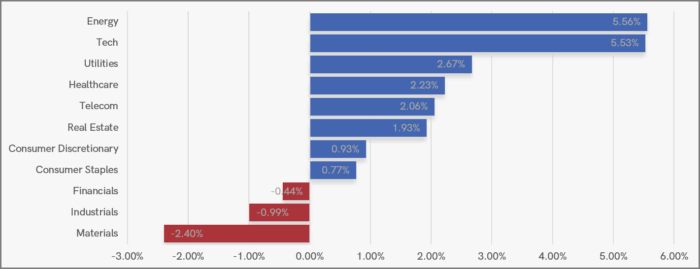
Momentum returned to the UK market this week with a broad-based rally led by Energy and Tech, both surging as optimism grew around global growth and easing inflation fears. Defensive names like Utilities and Healthcare also saw healthy gains, suggesting investors were happy to ride the rally without abandoning caution altogether.
Further down the leaderboard, Telecom and Real Estate also joined the upside, while Consumer sectors nudged forward in quieter fashion. The standout underperformers were Industrials, Financials and especially Materials, which slipped despite the broader market strength – a reminder of underlying caution.
UK Price Action
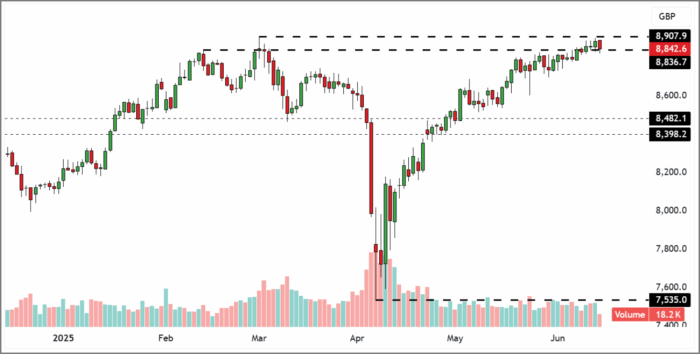
The FTSE is approaching breakout or fakeout time as prices push into the highs reached in early-March prior to Tump’s tariff blitz sell-off. Whilst we’ve actually seen a higher close this week which is a bullish sign, until the market breaks and closes at new highs we can’t call the breakout. It will also be worth watching volume to see if the breakout is support or not.
Disclaimer:
All content is provided for general information only and should not be construed as any form of advice or personal recommendation. The provision of this content is not regulated by the Financial Conduct Authority.


