13th Jun 2024. 9.01am

Regency View:
Update
Regency View:
Update
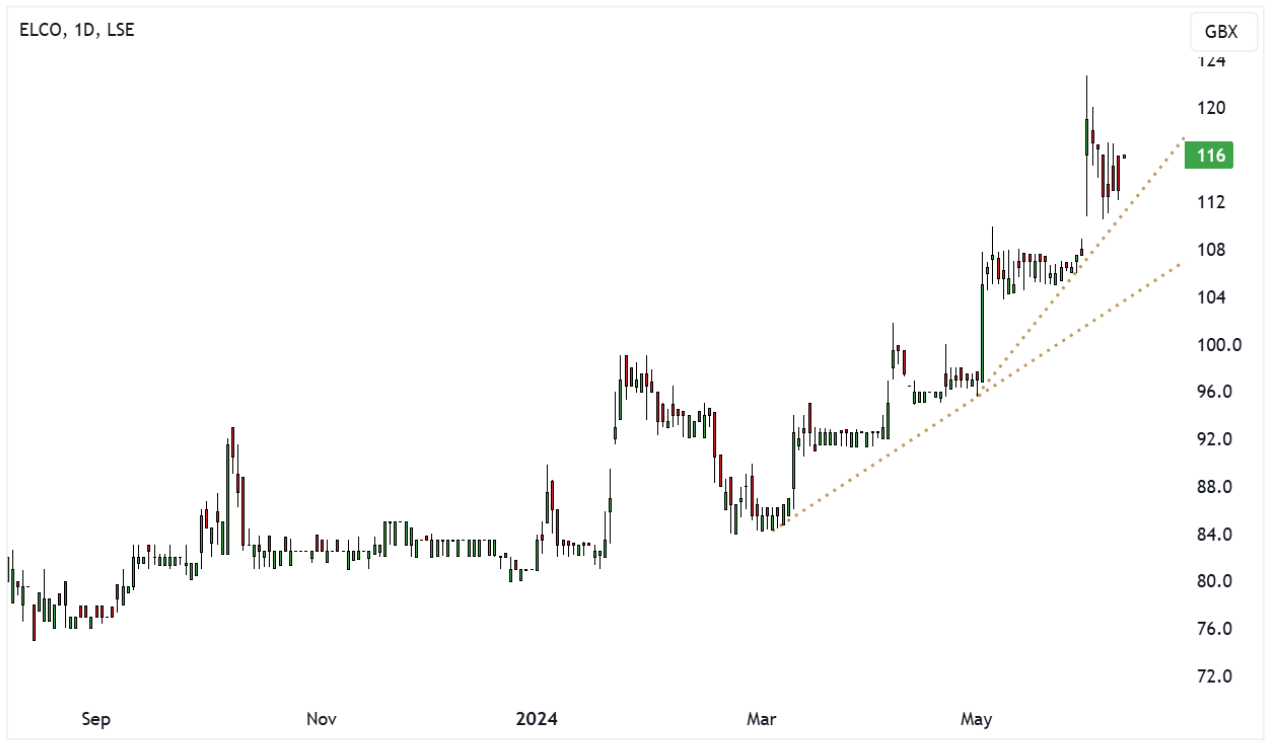
Eleco’s uptrend continues following strong AGM update
Eleco’s (ELCO) share price jumped last week following the AGM statement delivered by Non-Executive Chairman Mark Castle.
In his address, Castle highlighted the company’s solid trading performance over the first four months of the financial year. He reaffirmed that the business is on track to meet market expectations for the full year.
The announcement also underscored the significant 45% increase in Eleco’s share price over the past 12 months. This reflects growing investor confidence in the company’s prospects.
This positive sentiment has been buoyed by the recognition of Eleco’s hard work and successful delivery on its strategic goals. As a result, the market responded positively, driving the share price upward and enhancing the company’s market position.
ELCO Daily Candle Chart
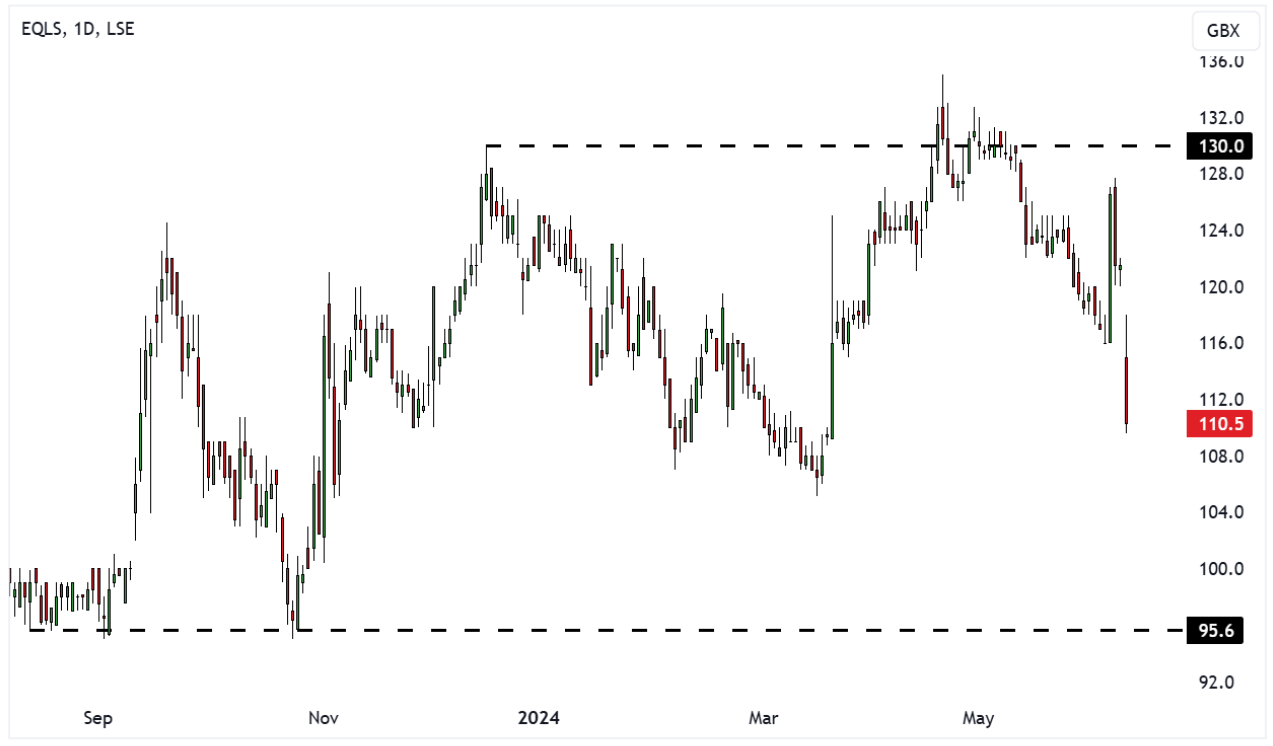
Equals drop as Madison Dearborn exits takeover talks
It’s been a volatile week of trading for Equals Group (EQLS), with shares initially rallying and then dropping after significant developments in its takeover discussions.
The week began on a positive note as investors were optimistic about the potential acquisition talks, driving the share price up. However, the situation took a turn when Madison Dearborn Partners, a key player in the negotiations, unexpectedly pulled out of the discussions. This withdrawal led to a sharp decline in share value, causing the stock to drop by 7% on Wednesday.

Despite this setback, there was some silver lining as Equals received an extension for ongoing takeover talks with a consortium comprising Embedded Finance and TowerBrook Capital Partners. These parties now have until July 10 to make a firm offer or abandon their bid, following the extension granted by the UK takeover panel.
Additionally, Equals Group disclosed that Madison Dearborn Partners, in collaboration with MoneyGram International, is exploring alternative commercial arrangements focused on Equals’ business-to-customer segment and technology platform. This indicates that while the immediate takeover bid has faltered, there could still be strategic partnerships or deals that benefit the company.
These events are part of a broader strategic review initiated by Equals last year to explore potential takeover proposals that might offer greater value to shareholders compared to remaining a standalone business.
EQLS Daily Candle Chart
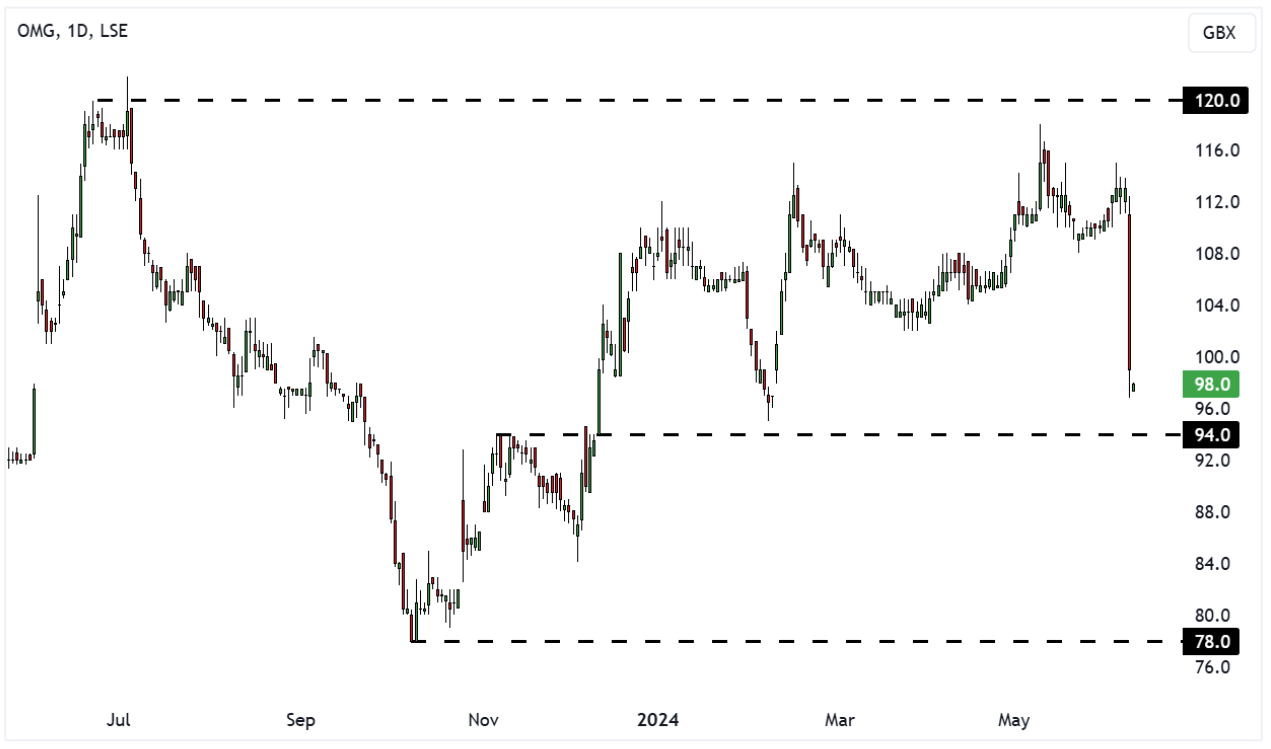
Oxford Metrics interim results disappoint
Oxford Metrics (OMG) experienced a sharp drop on Tuesday following the publication of its interim results, which were perceived as underwhelming by investors.
Despite the company reporting a 10.5% increase in revenue to £23.5 million and showcasing promising operational highlights, including the successful execution of its markerless motion capture technology by Vicon and the strong performance of Industrial Vision Systems (IVS), the market reaction was negative.

Investors were disappointed by the 9.4% decrease in adjusted profit before tax compared to the previous year, which stood at £4 million. Additionally, the decline in the order book to £3 million from £11.3 million in the previous fiscal year have contributed to concerns about future revenue generation.
Despite the company’s efforts to highlight >90% revenue visibility and a growing sales pipeline, the market has focused on the immediate figures, leading to negative sentiment. There remains plenty of technical support levels on OMG’s price chart and we expect buyers to step back in when the dust settles.
OMG Daily Candle Chart
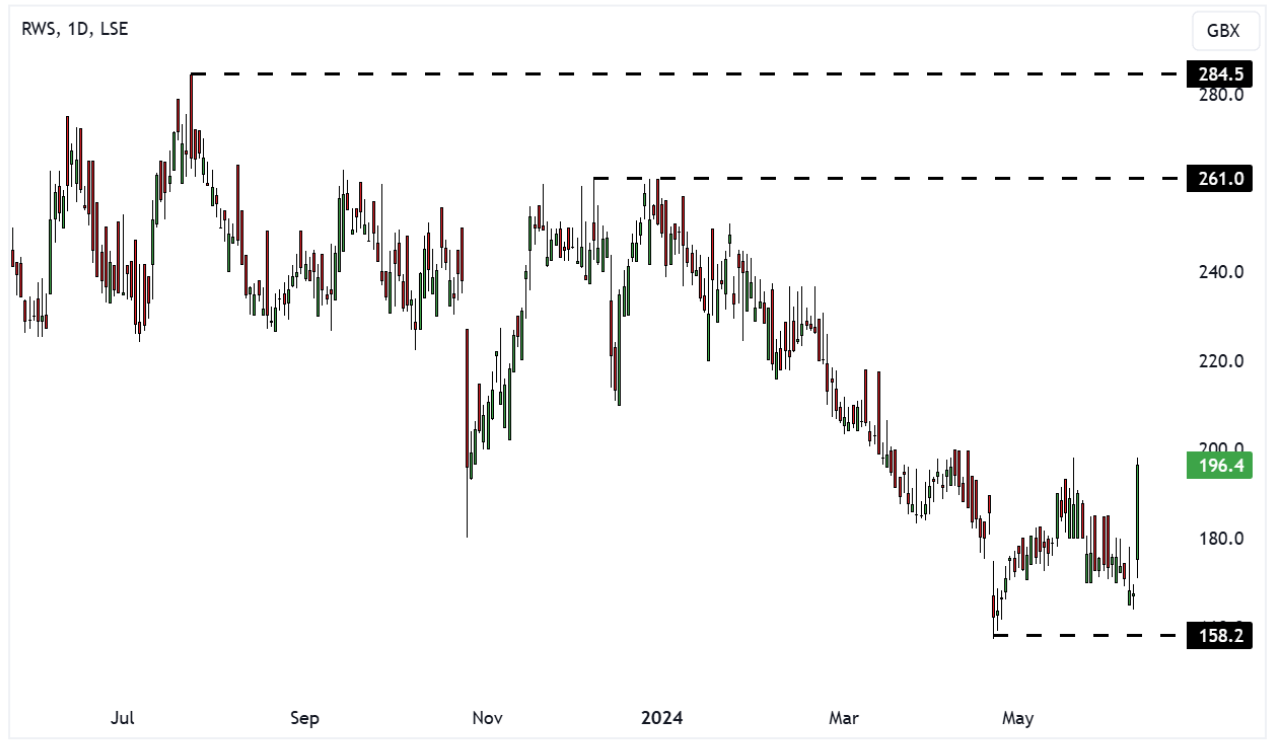
RWS rally on AI-related progress
RWS Holdings (RWS) have had a strong week with the shares rallying more than 15% on Wednesday following the publication of their half-year results.
Despite a reporting a 4% decline in revenue to £350.3 million, RWS’ results unveiled significant strides in its AI-related products. Revenues from AI-related products, including TrainAI and Language Weaver, contributed over a quarter of the Group’s total revenues, signalling solid growth in this key segment.

In addition to revenue metrics, other key financial indicators from the interim results contributed to the positive market sentiment. Despite a 16% decline in adjusted profit before tax to £45.6 million, the company’s cash conversion rate of 30% in the first half, although lower than the previous year’s 85%, was expected to revert to normal levels by the year end, providing reassurance regarding future cash flows.
The half-year results also shed light on RWS’ operational efficiencies and strategic initiatives. The Language eXperience Delivery (LXD) platform, driven by AI technology, emerged as a critical driver of productivity gains. This platform now manages the majority of the company’s localisation volume, with over 60% of content being machine-translated first by Language Weaver, underscoring the transformative impact of AI on RWS’ operations.
The market’s bullish response to the interim results reflected confidence in the company’s ability to leverage AI technology to drive growth and profitability in an increasingly competitive market.
RWS Daily Candle Chart
Inspecs drop despite positive AGM statement
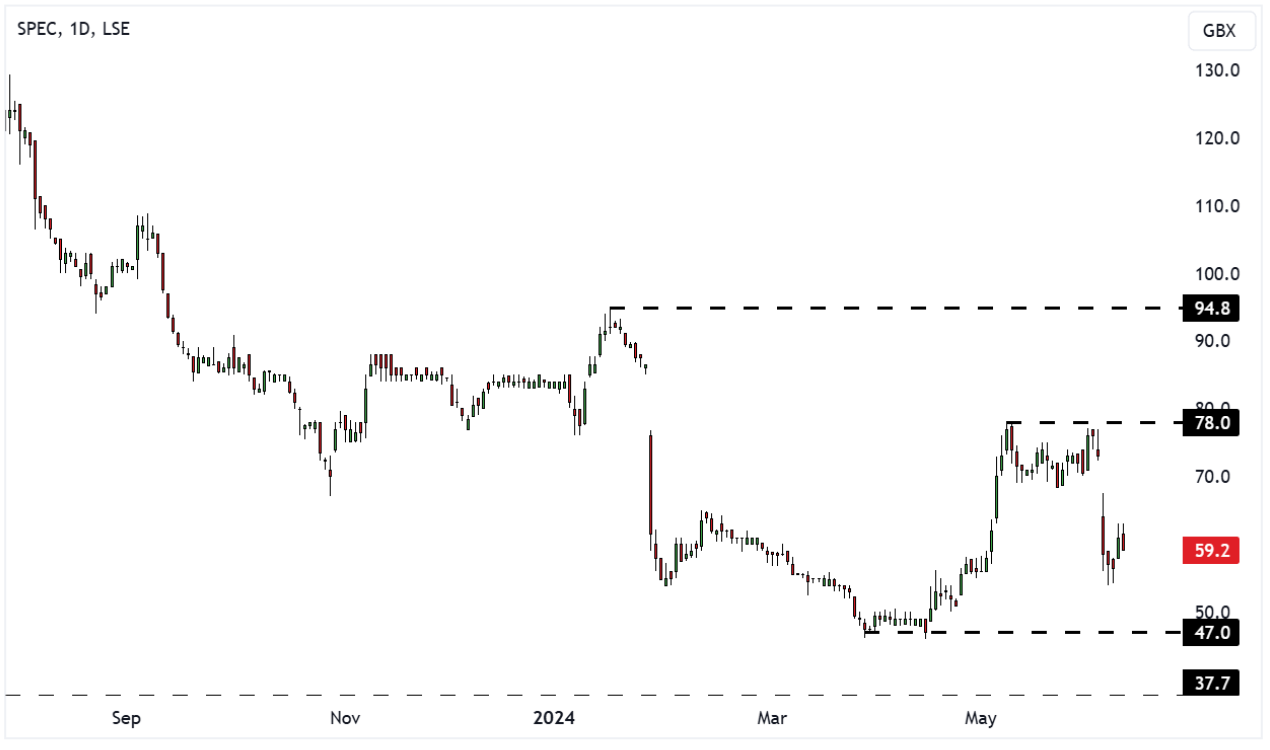
Despite Inspecs (SPEC) issuing a relatively positive AGM statement, the company experienced a decline in its share price last week. The market reaction suggests that investors may have focused on certain aspects of the trading update that tempered immediate enthusiasm.
While the AGM statement acknowledged Inspecs’ record performance in H1 2023, it also highlighted an anticipated decline in revenue and earnings (EBITDA) for H1 2024. This projection, aligning more closely with historical trading levels, gave some investors pause, especially considering the backdrop of a previous strong performance. The expectation of lower figures for the first half of 2024 has raised concerns about the company’s growth trajectory.

Additionally, despite unveiling plans for the launch of an in-house designed direct-to-consumer gaming eyewear range in London and the prospect of increased capacity at its new facility in Vietnam, the statement did not provide immediate assurance of a swift recovery or significant growth in the near term.
Overall, while the AGM statement conveyed a sense of cautious optimism and confidence in the company’s long-term prospects, the market’s reaction suggests that investors may have been more focused on short-term performance indicators and the potential impact on earnings.
SPEC Daily Candle Chart
TPX issues positive trading update and confirms guidance for FY25
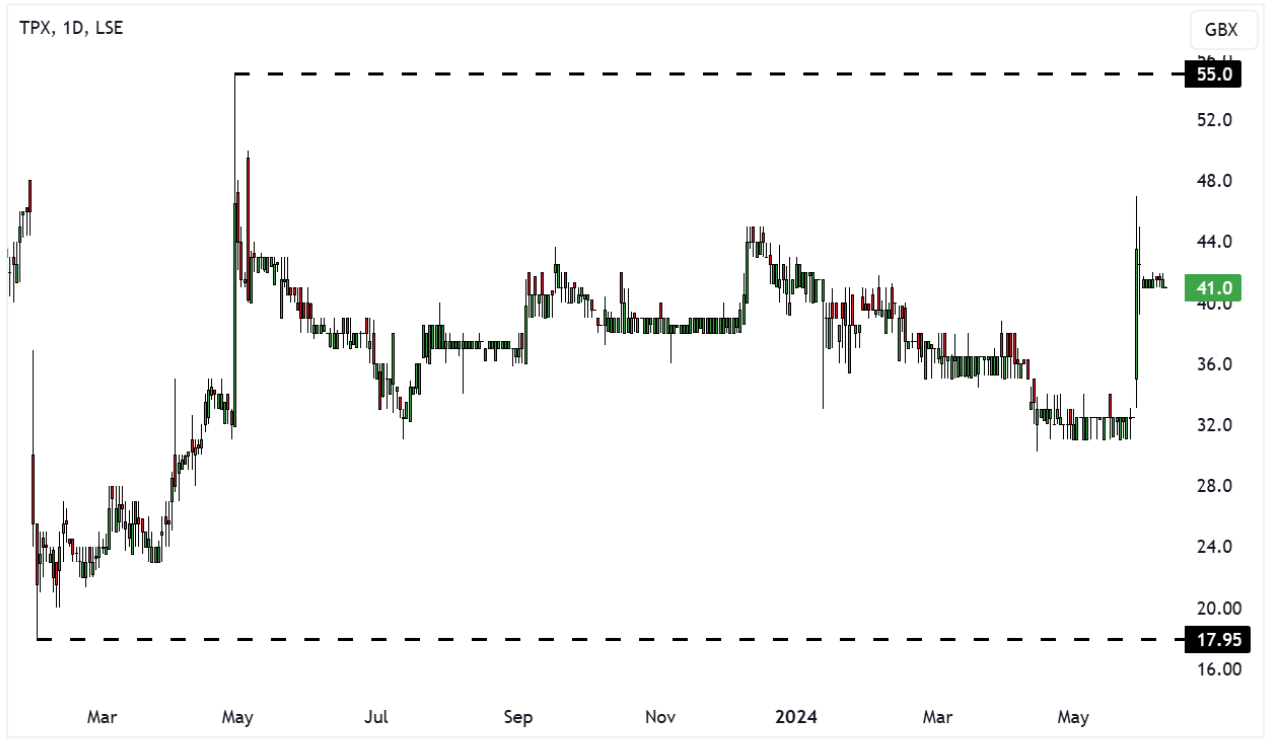
TPXimpact (TPX) recently issued a trading update for Q4 and the full year ending March 31, 2024 (FY24), along with guidance for FY25 and FY26.
The update indicated continued strong performance in Q4, with double-digit revenue growth expected for the full year, in line with previous guidance. Revenue growth from continuing operations is anticipated to exceed 20%, reaching around £84 million. Adjusted EBITDA margins are projected to be within the 5-6% range.
Net debt decreased to approximately £7 million, surpassing the target of £11 million, attributed to effective working capital management. New business wins for the year totalled £139 million, providing a solid foundation for future growth.
Looking ahead, the Board reaffirms FY25 targets of like-for-like revenue growth of 10-15% and further margin improvement of 2-3% compared to FY24. The company has commenced FY25 positively, with a strong pipeline of opportunities and committed revenues totalling £67 million, representing around 70% of the target full-year revenues. Despite potential disruption from the General Election in July, management remains confident in the company’s growth prospects and profitability.
For FY26, management targets like-for-like revenue growth of 10-15% and an Adjusted EBITDA margin of 10-12%, consistent with previous strategic goals.
TPX Daily Candle Chart
Disclaimer:
All content is provided for general information only and should not be construed as any form of advice or personal recommendation. The provision of this content is not regulated by the Financial Conduct Authority.
Disclaimer:
All content is provided for general information only and should not be construed as any form of advice or personal recommendation. The provision of this content is not regulated by the Financial Conduct Authority.