10th May 2023. 8.58am

Regency View:
BUY Softcat (SCT)
- Growth

Regency View:
BUY Softcat (SCT)
Catalysts realign to drive Softcat higher
Think VAR and painful memories of refereeing howlers probably come to mind.
But in the world of software and IT services, VAR stands for value-added reseller – a company that resells software, hardware and other services to provide value beyond the original order fulfilment.
VARs package and customise third-party products to add value and resell them with additional offerings bundled in.
Softcat (SCT) is the UK’s most successful VAR. They offer a single point of purchase for a broad range of tech solutions including public cloud, private cloud and IT security.
The business is highly cash generative and has plenty of scope for growth. And with fundamental and technical catalysts realigning in recent weeks, the stock looks a compelling buy.
Significant scope for domestic and international expansion
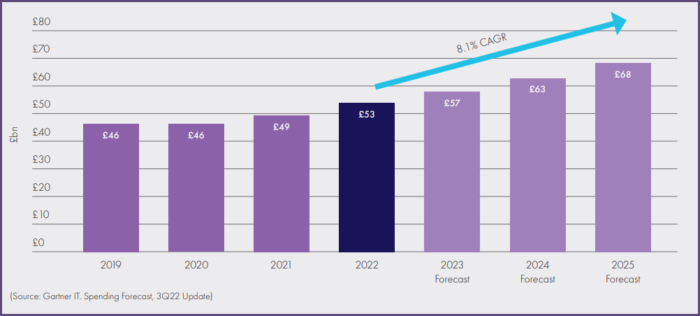
The UK VAR market was worth around £53bn in 2022 and, according to Gartner, it is forecast to grow at 8.1% p.a. through to 2025.
Many UK business are still laggards compared to global benchmarks on Digital Process adoption.
Moving to the cloud, being flexible on ways of working and enhancing security have all moved up the priority list for most businesses – creating a rich backdrop of organic growth for Softcat.
As the largest VAR in the UK, Softcat has just under a 5% market share, giving it the opportunity to continue to deliver market-leading growth.
Whilst Softcat currently only serve UK clients, they are well positioned for international expansion.
They currently have a modest number of international branches covering the Netherlands, Hong Kong, Singapore and Australia, designed to support UK and Irish customers in their overseas operations.
The addition of a US branch came last year and presents an exciting opportunity for Softcat given the vast size and scale of the US software & services market, which is worth an estimated $474bn and growing at a pace of 11.9% (CAGR) over the next seven years.
“We think that over time we will be able to attract new UK and Irish customers who have needs in North America as well as take on North American customers with international operations” commented CEO Graeme Watt.
“This presence in the US will enable us to better understand that market, providing insights that will benefit our wider operations and inform future strategy” he added.
Should Softcat make inroads into the US market, it has the potential to transform the group’s growth profile.
High quality financials
Softcat score highly across several metrics for quality…
Double-digit operating margins indicate that Softcat has a stable competitive advantage.
And a Return on Equity (RoE) which is consistently above 50% indicates that management know how to put shareholder capital to good use.
Cash generation is strong, with operating cashflow per share growing at a rate of 15.2% (CAGR) over the last five years.
More than 90% of operating cashflow flows through into free cashflow and this has created a rock-solid, debt-free balance sheet which has a net cash position of £97.7m on a trailing twelve-month (TTM) basis. This means Softcat are well placed to invest for organic growth and self-fund acquisitive growth.
Softcat’s strong financial position has given the stock a premium valuation. The shares trade on a forward price to earnings (PE) multiple of 24.1 which is high relative to its peers and the wider market.
However, Softcat are rewarding investors with a progressive dividend. The current yield is 2.7% and the dividend is covered more than twice over by earnings, giving plenty of scope for this pay-out to rise and many brokers expect Softcat’s yield to be closer to 4% over the next three years.
Technical and fundamental catalysts have aligned
Combining technical analysis (the collective market view on a stock) with underlying fundamental analysis (how the business is performing internally) is a powerful process that we use frequently when determining the right time to enter and exit a position.
During the last year, there has been a disconnect between Softcat’s technical and fundamental picture.
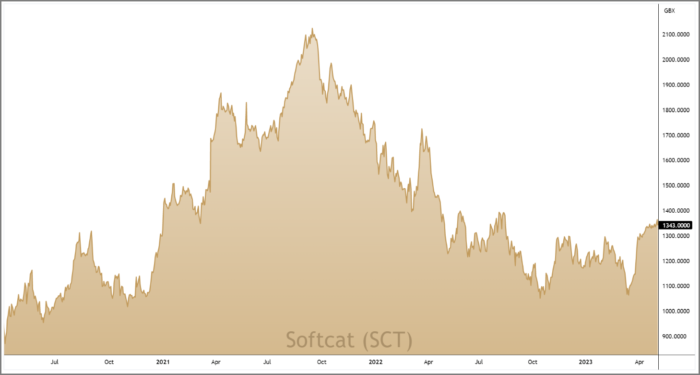
Between September 2021 and October 2022, Softcat’s share price halved in value as sentiment towards tech stocks waned. During the same period, Softcat’s fundamentals remained strong and the business achieved successive quarters of organic income and profit growth.

In recent months this disconnect has disappeared and we’ve seen both fundamental and technical catalysts realign…
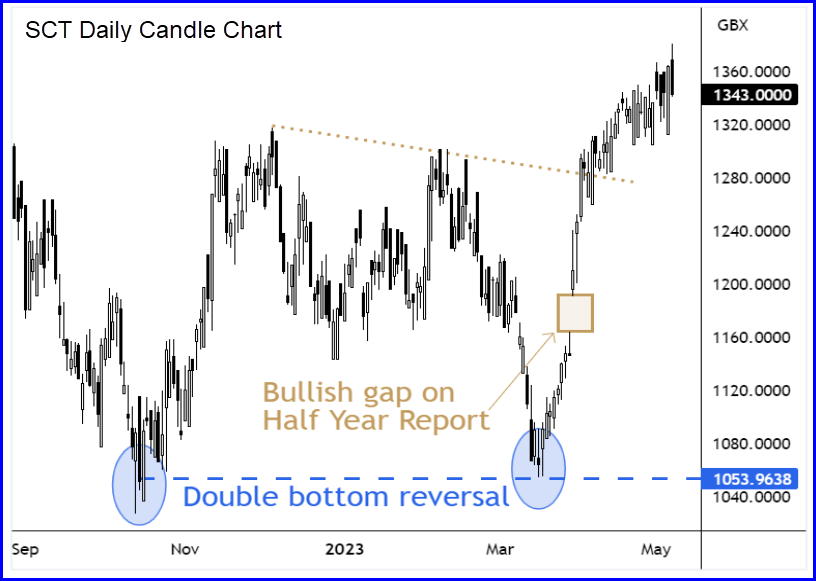
On the price chart, Softcat formed a double-bottom reversal pattern in March as prices bounced from the 1,053p support area.
This was followed by the release of Softcat’s Half Year results which saw income and profit performance ahead of expectations, coupled with strong cash generation.
In the six months to January, gross invoiced income (GII), which is effectively its underlying sales, increased 4.9% to £1.21bn. While gross profit jumped 17.9% to £177m – causing management to up their full-year outlook and propose an 9.6% hike to the interim dividend.
The market’s reaction to the Half Year results was bullish, with prices gapping higher and then breaking above the neckline (gold dotted line) of the double bottom.
With fundamental and technical catalysts aligned, the probabilities of success are tipped in our favour and we expect Softcat’s share price to have a strong second half of the year.
Disclaimer:
All content is provided for general information only and should not be construed as any form of advice or personal recommendation. The provision of this content is not regulated by the Financial Conduct Authority.


